Monday Morning Signal Brief — June 16, 2026
Used EV prices are moving. Everyone is blaming gas. The data says something else. Plus May SAAR, our Q3 model projection, and 1M Jeeps with a park-outside warning.
Week of June 16, 2026. Used EV prices are moving. Everyone is blaming gas. The data says something else. Then May SAAR, our Q3 model projection, inventory, rates, and the Texas market shift. Plus 1M Jeeps with a park-outside warning.
The used EV wholesale index is up. Gas prices did not do that. Here is what actually did.
The standard explanation for rising used EV prices goes like this: gas hit $4 a gallon, so buyers rushed to EVs, so prices went up. That narrative is convenient and mostly wrong. Here is what the primary data actually shows.
The wholesale used vehicle index for EVs has climbed throughout 2025 and into 2026, with three-year-old EV values up approximately 11% since the start of the year, per industry wholesale data. The median near-new used EV is now listed at $34,496, per the DGActual Retail Price Index, with pricing now near parity with comparable gas vehicles. Edmunds noted in May that the gap between used EV and gas car asking prices has compressed significantly over the past year. A year ago that spread was several thousand dollars.
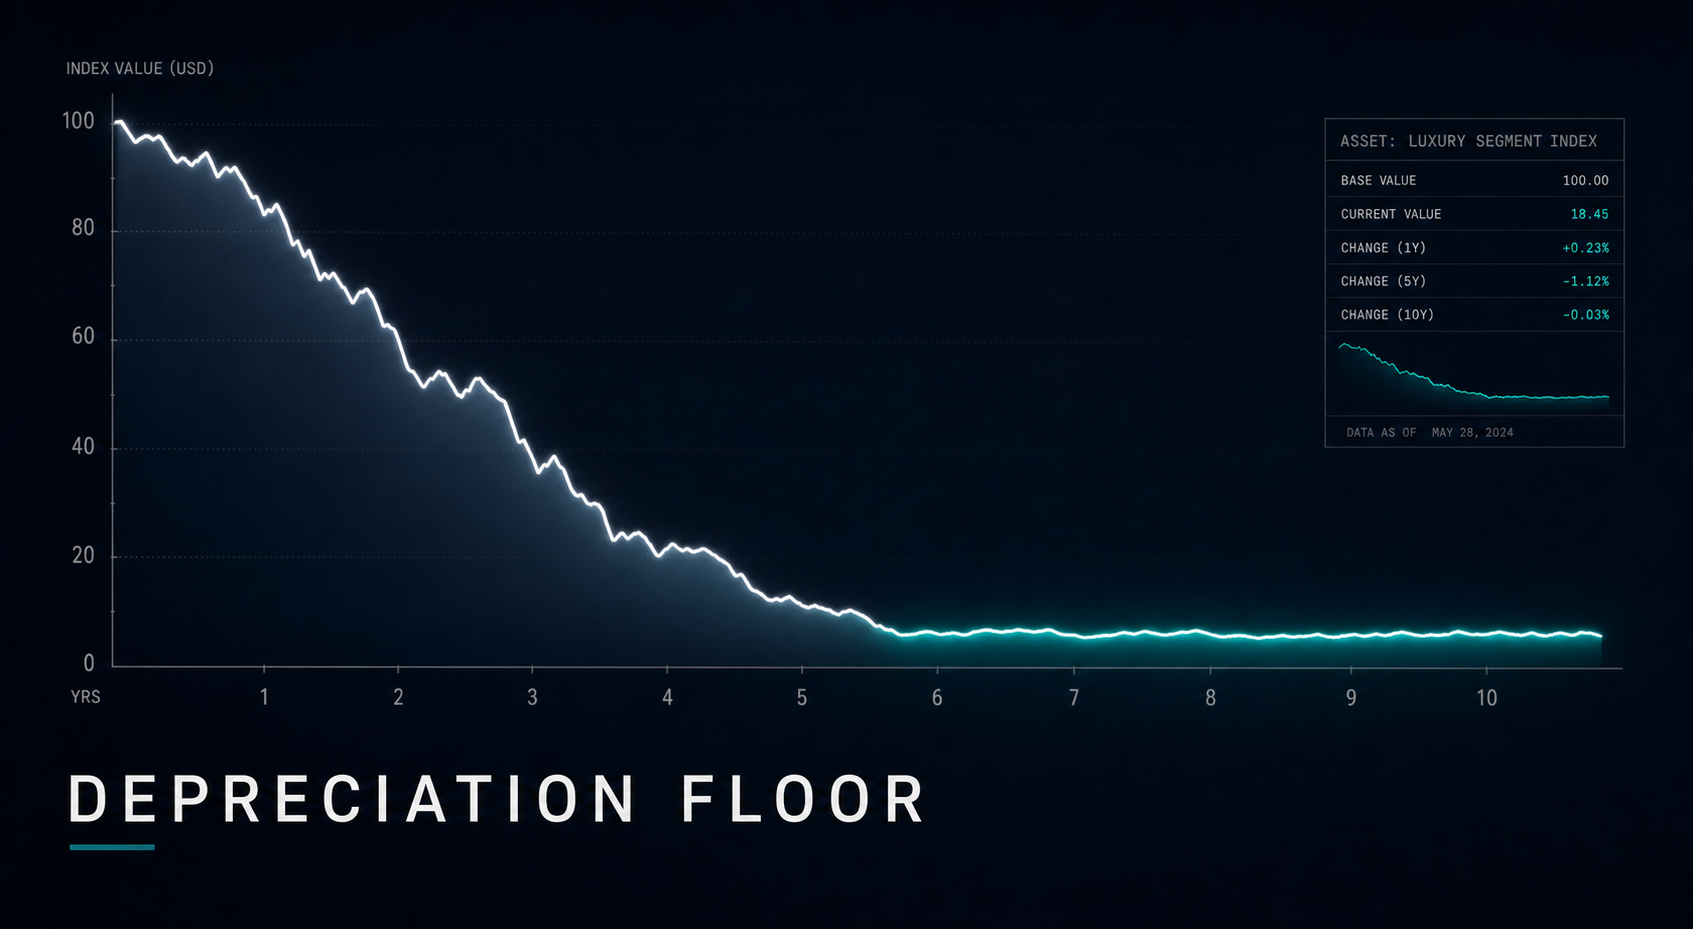
That price convergence did not come from demand pulling values up. It came from depreciation pushing them down to a floor. iSeeCars analyzed more than 950,000 transactions between March 2025 and February 2026 and found five-year-old EVs depreciating at an average of 57.2%, versus 41.8% for the overall market. That spread is what created the current price point: a 2022-2023 model year EV, off a three-year lease, absorbed most of that depreciation curve inside the captive finance portfolio. By the time it arrives at your lot, the steep part is already done.
The result is what Edmunds documented in May: the Mercedes-Benz EQS, originally $127,526 with an 82% lease rate, now selling at $49,290, roughly $16,880 below the residual lenders originally projected. That is not a gas price story. That is a scheduled supply event landing at a price point where the buyer math starts working.
To put a number on it: in the DGActual Retail Price Index, the median asking price for a used EV in the value tier, meaning the older, higher-mileage vehicles that have already absorbed most of their depreciation, is $22,393. The near-new tier, three years old or less, sits at $34,496, with a quarter of those listings already below $28,400. That is what a depreciation floor looks like in practice. A 2022-2023 model year vehicle that originally stickered at $45,000 or more is now sitting on a lot at a price where the payment math works, with current-generation tech and battery warranty still largely intact. The OEM finance arm absorbed the loss on the lease. The retail buyer gets the upside. (Full segment data: data.dgactual.com)
Now the critical caveat. The aggregate 'used EVs up 12%' headline is heavily compositional. iSeeCars found that from September 2025 to January 2026, used Teslas were up 4.3% while every other mainstream EV brand was down 3.6%. Tesla represents the majority of used EV volume, so the index moves with Tesla. The Hyundai Kona EV fell 6.4% in that window. The VW ID.4 fell 6.2%. The Mach-E fell 5.1%. Non-Tesla mainstream used EVs were not recovering, they were still softening.
On gas prices: Edmunds Senior Director of Insights Ivan Drury explicitly said it is 'too early to draw a concrete conclusion' about whether the gas price spike is driving the trade-in shift. EV trade-in rates did rise from 67.1% to 72.1% between January and April 2026, per Edmunds. That correlation is real. But as Drury noted, gas prices started rising after the Feb. 28 events. Three months of data is not causation.
The honest framing for this market: used EV prices are at a depreciation floor driven by scheduled off-lease supply, not a demand surge. Tesla is recovering from its own pricing reset and pulling the index up. Mainstream non-Tesla EVs are near price parity with gas at the $20,000-$25,000 level because they depreciated deeply, not because gas got expensive. Gas prices are a tailwind that accelerates discovery of a value that was already there. They did not create it.
For the desk: appraise EVs on their actual market position by model and trim, not on the headline index. Tesla trades differently than a Kona EV. A 2023 Ioniq 5 off lease with 25K miles is a different conversation than a 2020 Leaf. The wholesale headline masks a market that is deeply bifurcated.
Sources: DGActual Retail Price Index (data.dgactual.com); iSeeCars (950K+ transactions, March 2025-February 2026); Edmunds May 2026 used market report; Edmunds/Ivan Drury via Carscoops (May 31, 2026); industry wholesale data
May: 16.1M total, 14.8M retail. Our model says Q3 gets harder.
Two SAAR numbers matter here. Total SAAR for May came in at 16.1M, fleet included. Rental companies, government, and commercial buyers are in that number. They do not cross a dealer's floor.
Retail SAAR was 14.8M (J.D. Power, 1,231,900 units annualized). That is the consumer buying number. Fleet was roughly 1.7M, about 10% of total. For dealers, retail SAAR is the operating number.
The DGActual Automotive Stress Monitor projects total SAAR forward using consumer-demand inputs: UMich sentiment (49.8 in April, down 10 points from mid-2025), delinquency, unemployment, and auto loan rates. Base projection: total 15.9M Q3, 15.2M Q4. If fleet holds near 1.7M, that implies retail around 14.2M in Q3 and 13.5M in Q4. Meaningful step down from May's 14.8M retail pace.
Two drivers: sentiment fell hard, and April-May likely captured pull-forward demand ahead of tariff implementation. The model accounts for partial exhaustion entering Q3. What moved forward does not repeat. Uncertainty band: +/-1.1M while Q2 FRED data is still partial.
Average new-vehicle payment: $810/month. Hybrid share 15.2% YTD. BEV sales down 30.8% YoY through May. The market goes to whatever fits the payment.
| Quarter | Total SAAR | Est. Retail SAAR | Scenario |
|---|---|---|---|
| May 2026 (actual) | 16.1M | 14.8M | Actual |
| Q3 2026 | 15.9M | ~14.2M | Base |
| Q4 2026 | 15.2M | ~13.5M | Base |
| Adverse scenario: 1-sigma shock to sentiment and delinquency simultaneously | |||
| Q3 2026 | 14.4M | ~12.7M | Adverse |
| Q4 2026 | 12.9M | ~11.2M | Adverse |
Est. retail = total minus ~1.7M fleet (May 2026 J.D. Power implied). Uncertainty band: +/-1.1M on total (partial Q2 base). Full model methodology
Full SAAR model methodology: blog.dgactual.com/saar-forecast-2026
Source: NADA Market Beat / J.D. Power via MOTOR Information Systems (June 8, 2026); DGActual Stress Monitor v2.2 (FRED, June 15, 2026)
2.89 million units on the ground. Hybrids turn in 63 days, EVs in 68.
U.S. new-vehicle inventory started June at 2.89 million units, about a 75-day supply. Down from a February peak of 96 days. Hybrids are the fastest turn at 63 days. EVs at 68. Incentives held at 7.1% of average transaction price. Operational speed wins here: fast appraisals, same-day delivery, tight reconditioning. Stores leaning on discounts are giving away margin they do not need to.
Source: Catalyst IQ via Automotive News
Rates are not easing. 7.55% on 72-month bank loans.
Federal Reserve consumer credit data shows commercial bank 60-month rates at 7.52% and 72-month at 7.55% as of January-February 2026. Finance companies held at 6.1% since Q4 2025. Rate relief has not shown up in lender pricing.
Auto loan rates price off the 10-year Treasury, not the Fed funds rate. A full one-point Fed cut translates to roughly $20 per month on a typical auto loan. OEM rate programs move payments more than Fed policy does. Treat rate as fixed. Win deals with trade structure, term, and down payment.
Source: Federal Reserve consumer credit report
Texas is closing to 0.6 points behind California. The playbook has to catch up.
J.D. Power data shows Texas at 10.8% share of U.S. retail light-vehicle sales, with California at 11.4%. Six years ago the gap was 3.2 points. Texas buyers lean on cash and outside financing (69% of purchases), carry longer terms, and generate higher F&I PVR. If your allocation and marketing strategy were built around California demand, the math is shifting.
Source: J.D. Power via Car Dealership Guy
Recall Roundup: Week of June 9
Three recalls with direct service lane implications this week.
Jeep Wrangler and Jeep Gladiator, MY 2021-2025 (26V363 / 26V392). 1,076,999 vehicles. NHTSA issued an urgent park-outside warning. The electric hydraulic power steering pump wiring connection can overheat and create a fire risk, even with the ignition off. Owner letters expected July 9. Do-not-drive advisory in effect. Outbound calls to any qualifying Jeep in your database before the letters land.
Honda Pilot, Passport, Ridgeline, and Acura MDX, selected model years (26V365 / 26V367). 880,514 vehicles. Rear subframe corrosion at suspension mounting points in salt-belt states. Rust can weaken a suspension component and increase crash risk. High-volume recall with strong pull-through potential at Honda and Acura stores.
Chrysler Pacifica Plug-In Hybrid, MY 2020-2022 (26V362). 17,277 vehicles. High-voltage battery cells may fail internally and create a thermal runaway and fire risk. Do-not-drive advisory in effect. Dealers with PHEV inventory on lot or in service need to be aware.
DARPI Week 2 is live. Here is what one week of retail data shows.
The DGActual Retail Price Index completed its second weekly pull this morning. Base period is June 8, 2026 = 100. One week of movement is one observation, not a trend. Here is what moved.
Midsize cars moved the most in near-new pricing, up 0.49 index points, equivalent to +$114 on a $23,317 median. That is the only near-new segment move that clears $100 this week. Minivans moved the other direction: down 0.40 points, -$118. Both moves are worth watching but neither is signal yet. One week.
Volume is the more interesting story. The DARVI near-new composite moved to 100.63, meaning more inventory entered or was listed this week than at base. EVs led that: DARVI near-new at 102.09, the highest volume gain of any segment. More near-new EV listings hitting the market while near-new EV prices edged down 0.11 points (-$38). That is supply pressure, not demand pressure. The value cohort moved the other direction: EV value DARPI at 101.13 (+$253 on a $22,393 base), the biggest value-cohort gain of the week.
The EV reading is a meaningful first data point for the depreciation floor thesis in the lead story. Near-new EVs at retail are not yet recovering in price, and volume is rising. Value-cohort EVs (older, higher-mileage, already deeply depreciated) are firming. That split is consistent with the thesis: the floor is in the deeply depreciated tier, not at the near-new level where supply is still building.
Retail-wholesale spread: -0.01 points. Retail pricing held essentially flat against the rebased wholesale index. No compression, no widening. Neutral.
DOM across all near-new segments loosened slightly, with minivans adding the most at +2.0 days (now 64 days). All DOM moves this week are within the MarketCheck measurement noise range of 2-3 days. No DOM signal yet.
Also worth your time: How does your store rank?
The DGActual Google Review Index tracks ratings, review volume, and reputation scores across 17,058 U.S. franchise dealers. Search your store, your competitors, or filter by brand and market. Free, no login required.
Search the Dealer Reputation Index
Coming this week: Is Yelp still relevant for car dealers?
Your gut feeling about Yelp is probably right. It mostly captures the people who are furious, not the people who are satisfied. And there is real data to back that up. Yelp's review distribution is famously bimodal, heavy on 1-stars and 5-stars, and academic research confirms the platform disproportionately captures complaint-motivated reviews compared to Google. For car dealers specifically, the dynamic is worse than most categories. A new DGActual piece publishing this week lays out exactly what Yelp's own numbers show, why it still matters (hint: it feeds Apple Maps), and what the review platform stack actually looks like for dealers who want signal rather than noise.
Publishing this week at blog.dgactual.com
Daniel Govaer | EVP Product VINCUE | Loyalty Project Manager Beaver Toyota | Dealer Innovation Group Facilitator MyKaarma | Former Award Winning Mercedes-Benz General Manager | NADA Academy Class N367 Graduate
DGActual Signal Intelligence | dgactual.com