 DGactual
DGActual FY 2026 SAAR Forecast
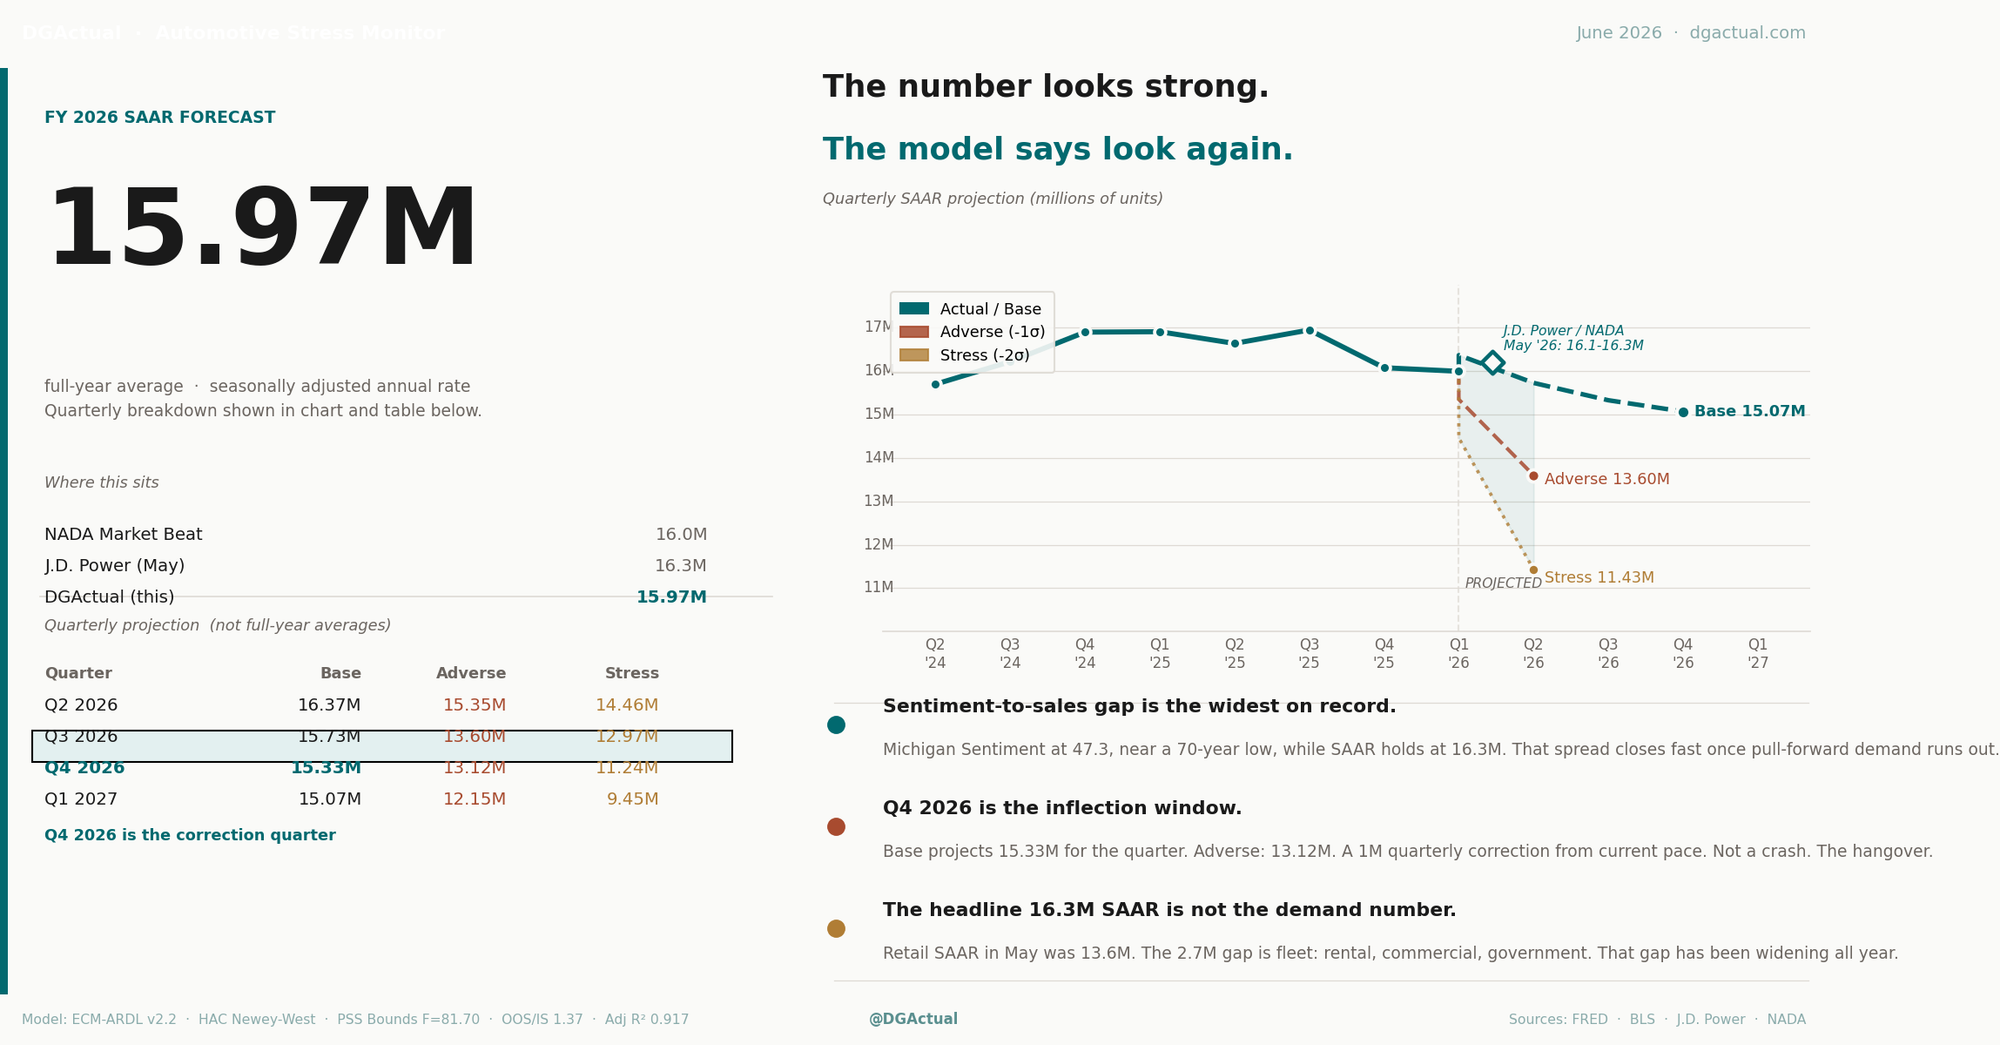
Total SAAR 16.1M, retail SAAR 14.8M in May. Our model projects Q3 base at 15.9M total / 14.2M retail as pull-forward fades and sentiment sits at 49.8. Adverse scenario: 14.4M total / 12.7M retail.
DGActual FY 2026 SAAR Forecast
Last updated: July 9, 2026. Model: DGActual Automotive Stress Monitor v2.2. Base quarter: Q2 2026 partial (April + May FRED TOTALSA average). Projections will re-anchor to confirmed Q2 2026 data when FRED publishes the full quarter, estimated mid-July 2026.
Two numbers, two stories
SAAR is reported two ways and they measure different things. Total SAAR, the number reported by FRED and most media, includes fleet: rental companies, government, and commercial buyers. It does not represent consumer demand at the dealership level. Retail SAAR, reported by J.D. Power, strips fleet out and reflects actual consumer purchases at franchised dealers.
For May 2026, total SAAR was 16.1M. Retail SAAR was 14.8M. The difference, roughly 1.7M units, is fleet volume. Fleet is driven by corporate capital cycles and rental company rebuild programs, not by the consumer-demand inputs that this model tracks. For dealers, retail SAAR is the operating number.
The DGActual model projects total SAAR forward. Estimated retail SAAR is derived by subtracting an assumed fleet volume of approximately 1.7M (May 2026 implied). Both figures are shown in the projection table below.
Current projections
FY2026 base call: 15.75M SAAR (four-quarter average of Q1 actual 15.80M, Q2 partial 16.45M, Q3 projection 15.49M, Q4 projection 14.98M). The model sees a real but orderly H2 deceleration — not a collapse.
| Quarter | Total SAAR | Est. Retail SAAR | Scenario |
|---|---|---|---|
| May 2026 (actual) | 16.1M | 14.8M | Actual |
| Q3 2026 | 15.49M | ~14.2M | Base |
| Q4 2026 | 14.98M | ~13.5M | Base |
| Q1 2027 | 14.8M | ~13.1M | Base |
| Q2 2027 | 14.6M | ~12.9M | Base |
| Adverse: 1-sigma shock to sentiment and delinquency simultaneously | |||
| Q3 2026 | 14.4M | ~12.7M | Adverse |
| Q4 2026 | 12.9M | ~11.2M | Adverse |
Est. retail SAAR = total minus ~1.7M fleet (May 2026 J.D. Power implied). Fleet held constant across quarters. Model uncertainty band: +/-1.1M on total SAAR (partial Q2 2026 base; will re-anchor when FRED publishes confirmed Q2 data, est. mid-July 2026). Tariff assumption: partial pull-forward exhaustion in Q3 (d_tariff_p = 0.5).
What is driving the H2 deceleration
Three factors are pulling the base projection below May's pace.
Consumer sentiment. The University of Michigan index averaged 47.3 in Q2 2026 (April 49.8, May 44.8), down more than 12 points from the 60-plus readings of mid-2025 and sitting near 2022 recessionary lows. Sentiment is the model's largest coefficient in magnitude. A sustained 10-point decline historically corresponds to roughly a 0.4-0.5M SAAR reduction in the following quarter.
Pull-forward normalization. April and May 2026 likely captured demand accelerated ahead of tariff implementation. The model includes a tariff pull-forward coefficient (+0.859M at full trigger). The base scenario assumes zero residual pull-forward demand in Q3 and beyond, based on J.D. Power June 2026 data confirming pull-forward exhaustion. The tariff coefficient (+0.859M at full trigger) is zeroed out. This means some of what moved in Q2 came from Q3 demand. The model does not assume a hard reversal, just normalization.
Payment pressure. Average new-vehicle monthly payment reached $810 in May 2026, up 2.8% year over year, even as promotional finance rates on select models dipped toward 6.59% (FRED consumer credit average: 7.47%). The payment increase reflects sustained vehicle price levels. With 13.4% of financed deals at 84 or more months and subprime delinquency elevated, the marginal buyer pool is constrained.
Model inputs and known limitations
Base inputs (Q2 2026 partial): SAAR 16.45M, UMich sentiment 47.3 (Q2 avg: April 49.8, May 44.8 — June not yet published), consumer installment delinquency 2.64% (FRED DRCLACBS, Q1 2026 latest), auto loan rate 7.47% (Fed consumer credit report).
In-sample fit: RMSE 0.618M, R-squared 0.929. Out-of-sample RMSE: 0.848M. OOS/IS ratio: 1.37. Cointegration confirmed (PSS bounds test F=81.7, reject H0 at 1%). HAC Newey-West standard errors applied.
Known limitations: the auto loan rate coefficients carry positive signs due to post-2020 multicollinearity with the demand cycle. At current rate levels (7.47%), this artifact may overstate the base projection by an estimated 1 to 4 million units. The base case should be treated as an upper bound on organic demand until the model is retrained with a sign-constrained rate coefficient. This is disclosed. The model projects total SAAR; retail SAAR is approximated by subtracting an assumed fleet volume. A retail-specific model version is planned for a future update.
DGActual Signal Intelligence | dgactual.com | Updated July 9, 2026