 DGactual
Monday Signal Brief: Week of July 13, 2026
A DARPI-led read for the whole floor. Our retail index shows used pulling below wholesale and demand softening, the economic dials point to a soft second half, and buyers are stretched on the monthly while driving the oldest fleet on record. What it means for sales, F&I, and service.
Here is what our own data is telling us this week, and what it means for how you run the store. One deep read on the retail market from our index, then the economic dials that actually move your traffic, then how buyers are behaving right now. Something for the sales floor, the service drive, and the F&I office, not only the corner office.
DARPI in depth: what our own retail index is telling you this week
This is the part of the brief you cannot get anywhere else, so it is worth a minute. Every used-car number you hear from an auction rep or a data vendor is a wholesale number. It tells you what a car brought at the sale, not what it will bring on your lot. DARPI is the other half of that picture. It is our own index of what dealers are actually asking for used vehicles, built weekly from millions of live dealer listings, and it is designed to be a forward read on retail, an early-warning gauge, not a rear-view mirror on the auction. Baseline 100 is June 2026. This is Week 6, dated July 12, and the data moved this week, which is exactly why we did not run last week's numbers here.
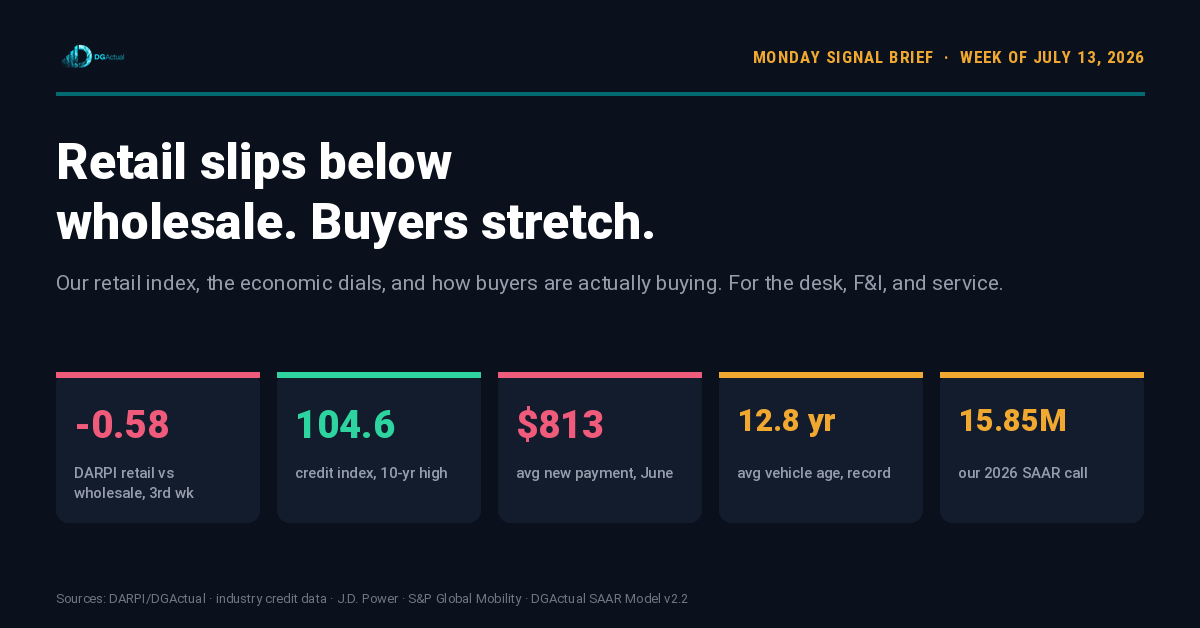
The single most important number in the report is what we call the retail-to-wholesale spread, and it just went to negative 0.58. Here is what that actually measures. We track two things side by side: what dealers are asking for a used car on their lot, and what that same class of car is worth at wholesale. When retail asking prices are climbing faster than wholesale, the spread is positive and there is margin building into the market. When the spread goes negative, it means dealer asking prices are slipping below the wholesale trend, the room between what you pay and what you can ask is closing. It has now been negative three weeks running, and it is not holding steady, it is widening: negative 0.32, then negative 0.33, now negative 0.58. If you are still setting your used numbers off a wholesale guide, you are anchoring to a figure that sits above where cars are actually being advertised to sell. Pull your last five appraisals and check them against the retail read before you commit another one off a wholesale-based number this week.
Underneath that, the top line tells the same story. DARPI Near-New is 99.42, down a quarter point on the week, and DARPI Value is 98.69. Supply is climbing while prices ease: near-new dealer inventory reached roughly 990,000 units, and in eight of our nine active segments supply is up and asking prices are down at the same time. That combination, more cars and softer prices, is what a demand-contraction signal looks like, and this is the sixth week the index has read that way. It is a slow grind, not a crash, and the danger with a grind is that the price line stays calm enough to lull you right up until the aging report catches you.
The segments are where it gets useful. Minivans are your fastest-turning segment at a 68-day median, with electric right behind at 70 days. Both are cases where demand is clearly there but the ceiling on what you can ask is coming down, minivan asking prices are off about 450 dollars since the baseline, and the EV price index has fallen the hardest of any segment over the past month. Read that honestly: these are the fastest movers on the board, but 68 days is still more than nine weeks to turn your best-moving metal, and that is the healthy end of this market, not a quick one. Priced tight to the median they move at that pace. Priced a notch high they sit past 90 days and drag your aging report. On minivans specifically, the combination of the quickest turn on the board and softening asking prices means you can be more aggressive on the trade this week and still move the unit at that 68-day pace.
Full-size pickups are the opposite case and the clearest place to protect yourself. They carry the highest median price of any major segment, right around 42,000 dollars, and the slowest turn among high-volume segments at 115 days, with supply up four percent since the baseline and asking prices still drifting down. Take a truck trade this week at a number that assumes 120 days or more to retail, not 60. Luxury is telling a similar story from the top of the market: asking prices down more than 400 dollars, sitting 120 days, and it carries the widest gap between what a dealer paid at baseline and what the unit is worth now, close to 4,800 dollars a car. If you are long on aged luxury or aged trucks, that is where the discount discipline belongs this week.
Two bright spots worth naming. Midsize car, the Camry and Accord and Altima kind of inventory, is the only near-new segment on the board where asking prices are still higher than the June base, up about 156 dollars, because budget-tighter buyers are gravitating straight to reliable, high-mileage-tolerant sedans. Hold your number there. And compact car has the tightest price spread of anything we track, only about 4,600 dollars between the low and high quarter of the market, which means on those cars condition and mileage drive almost the entire number. Appraise them mechanically: check the car in front of you first, and the price follows.
So the plan the data writes for the week: stop pricing used off wholesale while the spread is negative and widening, watch days-on-market as your early-warning line because in a grind it moves before price does, price your fast movers (minivans, late-model EVs) tight to the median instead of reaching, and put your markdowns on the slow, high-dollar aged metal, above all older trucks and luxury, where the clock and the dollar gap point the same way.
The full segment and brand tables, the six-week spread history, and the per-segment supply and aging detail update weekly at data.dgactual.com/darpi.
Economic indicators: the dials that move your traffic
DARPI tells you what is happening on your used line. These are the dials underneath it, the ones that decide who walks in and whether the deal you write today comes back to bite you. Four of them are worth watching right now, and each one changes how you talk to a customer this week.
Credit availability just hit a ten-year high. The index that tracks how easy it is to get a car loan approved rose to 104.6 in June, its highest reading in more than a decade, up 7.3% from a year ago. Lenders are saying yes more often, to more people, on longer terms. This is not the pure good news it sounds like. Easier approval does not make a car cheaper, it just widens the door for a deal that was already a stretch. The opportunity is real: deals that were dying on the approval can close now. The trap is using loose credit to push a stretched buyer further out on term instead of structuring a payment they can actually carry.
Rates are stuck, so the refinance pitch is dead. Inflation running at a three-year high has taken near-term rate cuts off the table. That kills the buy-now-refinance-later story you might have told a fence-sitter last year. The honest line to a customer today is simpler and it holds up: if the numbers work now, waiting for a lower rate that is not coming is not a plan. Sell the deal that works today on its own merits.
The tariff clock is a cost signal, not a sticker signal. A Section 122 import surcharge that has shaped import math since February expires July 24, and USMCA talks resume in Mexico City the week of July 20. Do not promise customers a price drop on the 24th, because finished-vehicle math barely moves. Where it does land is parts and accessories, so the near-term exposure is in fixed ops, not the new-car board. Treat the next two weeks as a window to lock parts and accessory costs before whatever replaces the surcharge lands.
And the pace stays soft. The full-year new-vehicle forecast sits around 15.8 million, a decline of roughly 3% from last year, even though June ran hot at about 1.36 million units. A fast month is not a fast year. Plan staffing and inventory for a market that grinds rather than sprints through the back half.
Consumer behavior: how people are actually buying right now
This is the part most market reports skip, and it is where the next customer actually comes from. The numbers below are our own read on how buyers are behaving, built on affordability data measured by J.D. Power, Edmunds, and Experian. They point at three shifts you can act on this week, and they reach past the sales desk into F&I and the service drive.
Buyers are squeezed on the monthly, not priced out on the sticker. The average new-car payment ran about 813 dollars in June on a 6.7% APR, and incentives climbed to roughly 3,217 dollars a unit as manufacturers work to keep deals alive (figures measured by J.D. Power). People still want the car, they just cannot carry the payment at the shape it is in. This is a deal-structure problem, and you solve it with term, down payment, and the right unit, which is exactly why the affordable segments in the DARPI read are turning fastest.
The 84-month loan is now the release valve, and it is building a future problem. Nearly 24% of new-vehicle loans in the second quarter ran 84 months or longer, a record share (Edmunds). Meanwhile 29.5% of trade-ins came in underwater, up more than a point from a year ago, and average negative equity is climbing (Experian). Connect those two: every long-term deal you write today is a negative-equity trade walking back onto your lot in three or four years. F&I is where you get ahead of it, with equity protection and a payment the customer can actually finish rather than merely start.
Leasing is coming back as the pressure valve, and it belongs in the conversation. As payments stretch, more shoppers are looking at a lease to get into a newer unit for a payment they can carry, and the lease-versus-buy gap is wide enough right now, on the order of 150 dollars a month, that it changes which customers you can actually close. For a stretched buyer who would otherwise sign an 84-month note, a lease can be the more honest structure. Put it on the board rather than defaulting every deal to the longest term that pencils.
And the car they already own is your best inventory. The average vehicle on the road hit a record 12.8 years old in 2025 and is pushing toward 13, because high prices are keeping people in what they have. That has two direct reads for your store. First, your service drive is the strongest trade-acquisition channel you have right now, those aging cars are equity sitting in your own lane, so mine it before you chase a competitive auction. Second, it is fixed-ops volume: service cost per mile rises more than fivefold as a vehicle ages from new to past ten years, and the bulk of a vehicle's lifetime service spend lands after year five (2026 fixed-ops and ownership study). The customer who cannot afford to replace the car will spend to keep it running, and that work should be happening in your lane, not an independent shop's.
So the behavioral plan for the week: structure to the payment, not the price, and put leasing on the board for stretched buyers instead of reflexively reaching for 84 months. In F&I, treat every long-term note as a future negative-equity trade and get ahead of it. And in fixed ops, work the aging fleet deliberately, it is both your best used-car supply and your most reliable service revenue.
From the model: our second-half call is holding
Back on June 16 our SAAR forecast model called for new-vehicle sales to cool in the second half and land near 15.85 million for the full year. On July 10, the trade press ran the same read: a strong summer giving way to a softer back half, pacing below last year.
Here is why that matters, and why it is built differently. The standard approach measures this month's sales pace and has a panel of economists judge where the year goes. Our model works the other way. It reads public economic data and consumer sentiment and projects the full year itself, then separates the total light-vehicle number from the retail demand a dealer actually feels, because fleet volume pads the headline but does not walk onto your lot. It also treats a hot monthly pace as a data point, not a trend. June ran hot, but a fast month is not a fast year.
The major forecasters land between 15.8 and 16.2 million for 2026. We called 15.85, independently, at the conservative end, and we had the direction on record before the trade press published it. It is one data point and the year is not over, so this is a first signal, not a victory lap. But the call is holding, and it came from one operator and a model rather than a room full of economists.
One comparison is worth sitting with. The National Automobile Dealers Association, the largest dealer body in the country, has held its full-year forecast at 16.0 million all year, and reaffirmed it at the end of June. We are at 15.85, about 150,000 units lighter. That gap is small on paper but it is a real disagreement about direction, because their own year-to-date pace through June was 15.9 million, which means holding 16.0 for the year needs the second half to stay firm or pick up. Our model says the opposite: the back half softens. If the softening our retail index is already flagging shows up in the sales pace, the more conservative number will have been the better one, and it came from a transparent model rather than a stated figure.
The full forecast and the reasoning behind it live at data.dgactual.com.
Open recalls worth running this week
Three campaigns worth proactive outreach. All figures from NHTSA.
- Kia Telluride, model years 2020 to 2024, 462,869 vehicles, campaign SC374, replacing prior recall 24V407. The front power seat motor can overheat from a stuck slide knob or an improper prior repair, with fire risk in park or while driving. This is a park-outside warning, park away from structures until repaired. Dealers install an electronic fuse assembly at no cost, with the remedy available in early August and owner letters mailed August 13. Vehicles fixed under the prior recall need this repair again, so pull your prior 24V407 service records and call those owners first.
- Honda Odyssey, model years 2018 to 2020, 325,588 vehicles, built January 2017 through July 2020. The rearview camera image may fail to display, which does not meet the federal rear-visibility standard. The remedy replaces the rearview camera at no cost, a straightforward service-lane appointment.
- Ford Mustang, model years 2024 to 2026, 110,626 vehicles across two campaigns. The larger, 67,842 gas Mustangs, covers a windshield-wiper defect. The second covers a Mach-E rear differential pinion-shaft issue. Both are near-term service appointments.
Source: NHTSA Part 573 reports via DGActual weekly recall log.
The Wheelhouse is back

By popular demand, my podcast The Wheelhouse is coming back to life. No topic stays off the table. It is fast paced, hard hitting, and sometimes genuinely funny, loosely built in the spirit of Around the Horn. Sharp operators, contrarians, and category leaders at the table, digging into the subjects the industry likes to tiptoe around.
I am looking for participants for upcoming episodes. If you want a seat at the table, or you know someone who belongs there, email hello@dgactual.com and tell me who you are and what you would not tiptoe around.
That is the week. Our index says retail is pulling below wholesale and demand is the pressure point on your lot, the dials point to a soft grind rather than a rebound, and buyers are stretched on the monthly while sitting on the oldest fleet on record. Play for turn and equity, structure every deal to a payment the customer can actually carry, and work the cars people already own, both as your best trade supply and your most reliable service revenue.
Dealer-level ratings and market data live at reviews.dgactual.com and data.dgactual.com. Research support provided by AI tools; analysis and editorial by Daniel Govaer.