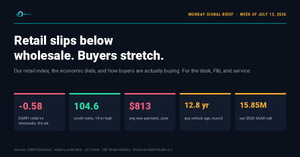
DARPI — DGActual Retail Price Index
Weekly used vehicle retail price index tracking 40M+ dealer listings across 10 segments, plus private party FSBO brand data across 34 brands. Updated every Monday.

The DGActual Retail Price Index (DARPI) is a weekly used vehicle market intelligence tool built from 40 million+ active dealer listings across the United States, plus private party (FSBO) brand data updated every Monday from live MarketCheck data.
Unlike wholesale indices that track auction prices, DARPI measures what dealers are actually asking on their lots, and what private sellers are asking consumers directly. The retail asking price, not the wholesale clearing price. That distinction matters for understanding margin compression, consumer purchasing power, and where retail demand is actually moving week to week.
Live Dashboard
Full interactive dashboard below. Four tabs: Overview, Segments, Retail vs Wholesale, and FSBO Market. Toggle between Near-New (1-5yr) and Value (6-10yr) dealer cohorts, explore segment-level data, and track private party brand intelligence.
Open full dashboard · Source: MarketCheck API · 40M+ US dealer listings · Updated weekly · Base: June 2026 = 100
Open full dashboard at data.dgactual.com
What DARPI Measures
DARPI tracks two dealer cohorts across ten vehicle segments, plus private party (FSBO) brand intelligence, every week:
- Near-New (1-5yr): CPO-adjacent dealer inventory. Competes directly with new car payments. When this softens, dealers feel it in front gross and trade values compress.
- Value (6-10yr): Workhorse dealer retail inventory. Higher sensitivity to subprime credit, income pressure, and rate environment. Signals consumer financial stress before it shows up in delinquency data.
- FSBO Market tab: 34 brands tracked by private listing volume, median asking price, and median DOM. EV brands highlighted as a priority signal.
The Ten Dealer Segments
- Compact SUV: Largest by volume. ~289K near-new listings. Bellwether for used market direction.
- Midsize SUV: Family purchase driver. ~222K listings. Sensitive to rate environment.
- Full-Size Pickup: ~265K near-new listings, slowest DOM at 106 days. High supply, selective buyers.
- Luxury: Off-lease volume driving supply. ~223K near-new units.
- Electric: Fast-moving at 65d DOM. Off-lease wave accelerating supply in 2026-2027.
- Fullsize SUV: Highest median price at $56K near-new. Premium demand signal.
- Midsize Car: ~91K near-new. Stable demand anchor.
- Compact Car: Most affordable near-new at $20.5K median. First-time buyer indicator.
- Minivan: Fastest DOM at 62 days. Strong family demand, efficient turn.
- Fullsize Car: High volume (~247K) but long DOM. Aging segment with uneven demand.
FSBO Market Tab
34 brands tracked across three groups mirroring the DARPI retail segment structure: Mainstream Volume, Luxury, and Electric/EV-Primary. Each brand shows total private party listings nationally, median asking price, and median DOM computed from a 1,000-listing sample.
EV brands are the priority signal. Tesla FSBO clears in 26 days median DOM — fastest moving brand in the entire private party market. Rivian at 28 days. Lucid at 23 days. EV wholesale is up 11.9% YoY and private EV sellers are keeping pace. The supply wave arrived and demand absorbed it.
How the Dealer Index Works
Base period: June 2026 = 100. Each week, every segment gets an index value relative to that starting point. A reading of 102 means prices are 2% above the baseline. A reading of 97 means prices have softened 3%.
Composite DARPI is a weighted average across all ten segments by listing volume. Near-New and Value cohorts are tracked separately. Credit availability, rate sensitivity, and off-lease timing affect them differently.
Data source: MarketCheck API, Basic tier. 40M+ active dealer listings in the US. DOM figures run from scrape date, not actual lot arrival. Use DOM directionally, not as an absolute.
Retail vs Wholesale
The Retail vs Wholesale spread view compares dealer asking prices to industry wholesale market data rebased to the same index. The spread is where variable gross lives and where margin compression shows up first when demand softens faster than wholesale adjusts.
Why This Exists
Wholesale indices have dominated automotive market intelligence for decades. But wholesale prices reflect what dealers paid last week. Retail asking prices reflect what consumers are being offered today. DARPI is a retail-first signal. Built from active listings, updated weekly, available publicly. No paywall. No NDAs. Just the market, measured from the consumer side.
Built by Daniel Govaer, EVP Product VINCUE | Former Award Winning Mercedes-Benz General Manager | NADA Academy Class N367 Graduate
Questions or methodology feedback? dgactual.com or @DGActual on X.