 DGactual
DGActual Market Brief — Week of August 3, 2026
Q2 earnings are complete. Service is carrying the industry. Used vehicle reconditioning generated 22x more profit growth where it was managed. Three weeks of demand contraction. Toyota factories halted. And 5,718 dealer ratings decoded.
JUMP TO SECTION
Q2 earnings are in for the six public dealer groups and just wait until you see what‘s interesting there, the used vehicle market just logged its third straight week of softening, and Toyota's earthquake-related factory halt in Japan is affecting the exact models that were already moving fastest off lots. Dealer Google ratings across 17,814 stores are remarkably steady: 93.4% of scores held flat month over month. Most of the industry is right where it was. The interesting things are happening at the edges. This weeks intel brief is so juicy I had to include navigation buttons at the top. Here's what you need to know walking into the week.
Overview: what just happened across the industry
Six public dealer groups finished reporting Q2. The headline isn't who beat and who missed. The headline is what's actually carrying the business in 2026 versus what used to carry it.
Two years ago, the front of the dealership was where the money lived. New vehicle gross profit per unit was inflated by supply shortages, and dealers were running strong front-end margins without needing much operational complexity to do it. That era is over. Every group reporting this quarter showed new vehicle GPU compression, and none of them are growing it. The groups doing well right now are doing well because of what's behind the showroom: the service bays, the reconditioning line, the finance office.
That's the story of Q2 2026. The operational depth of a dealership has become its financial foundation.
Service and parts: the department carrying the entire industry
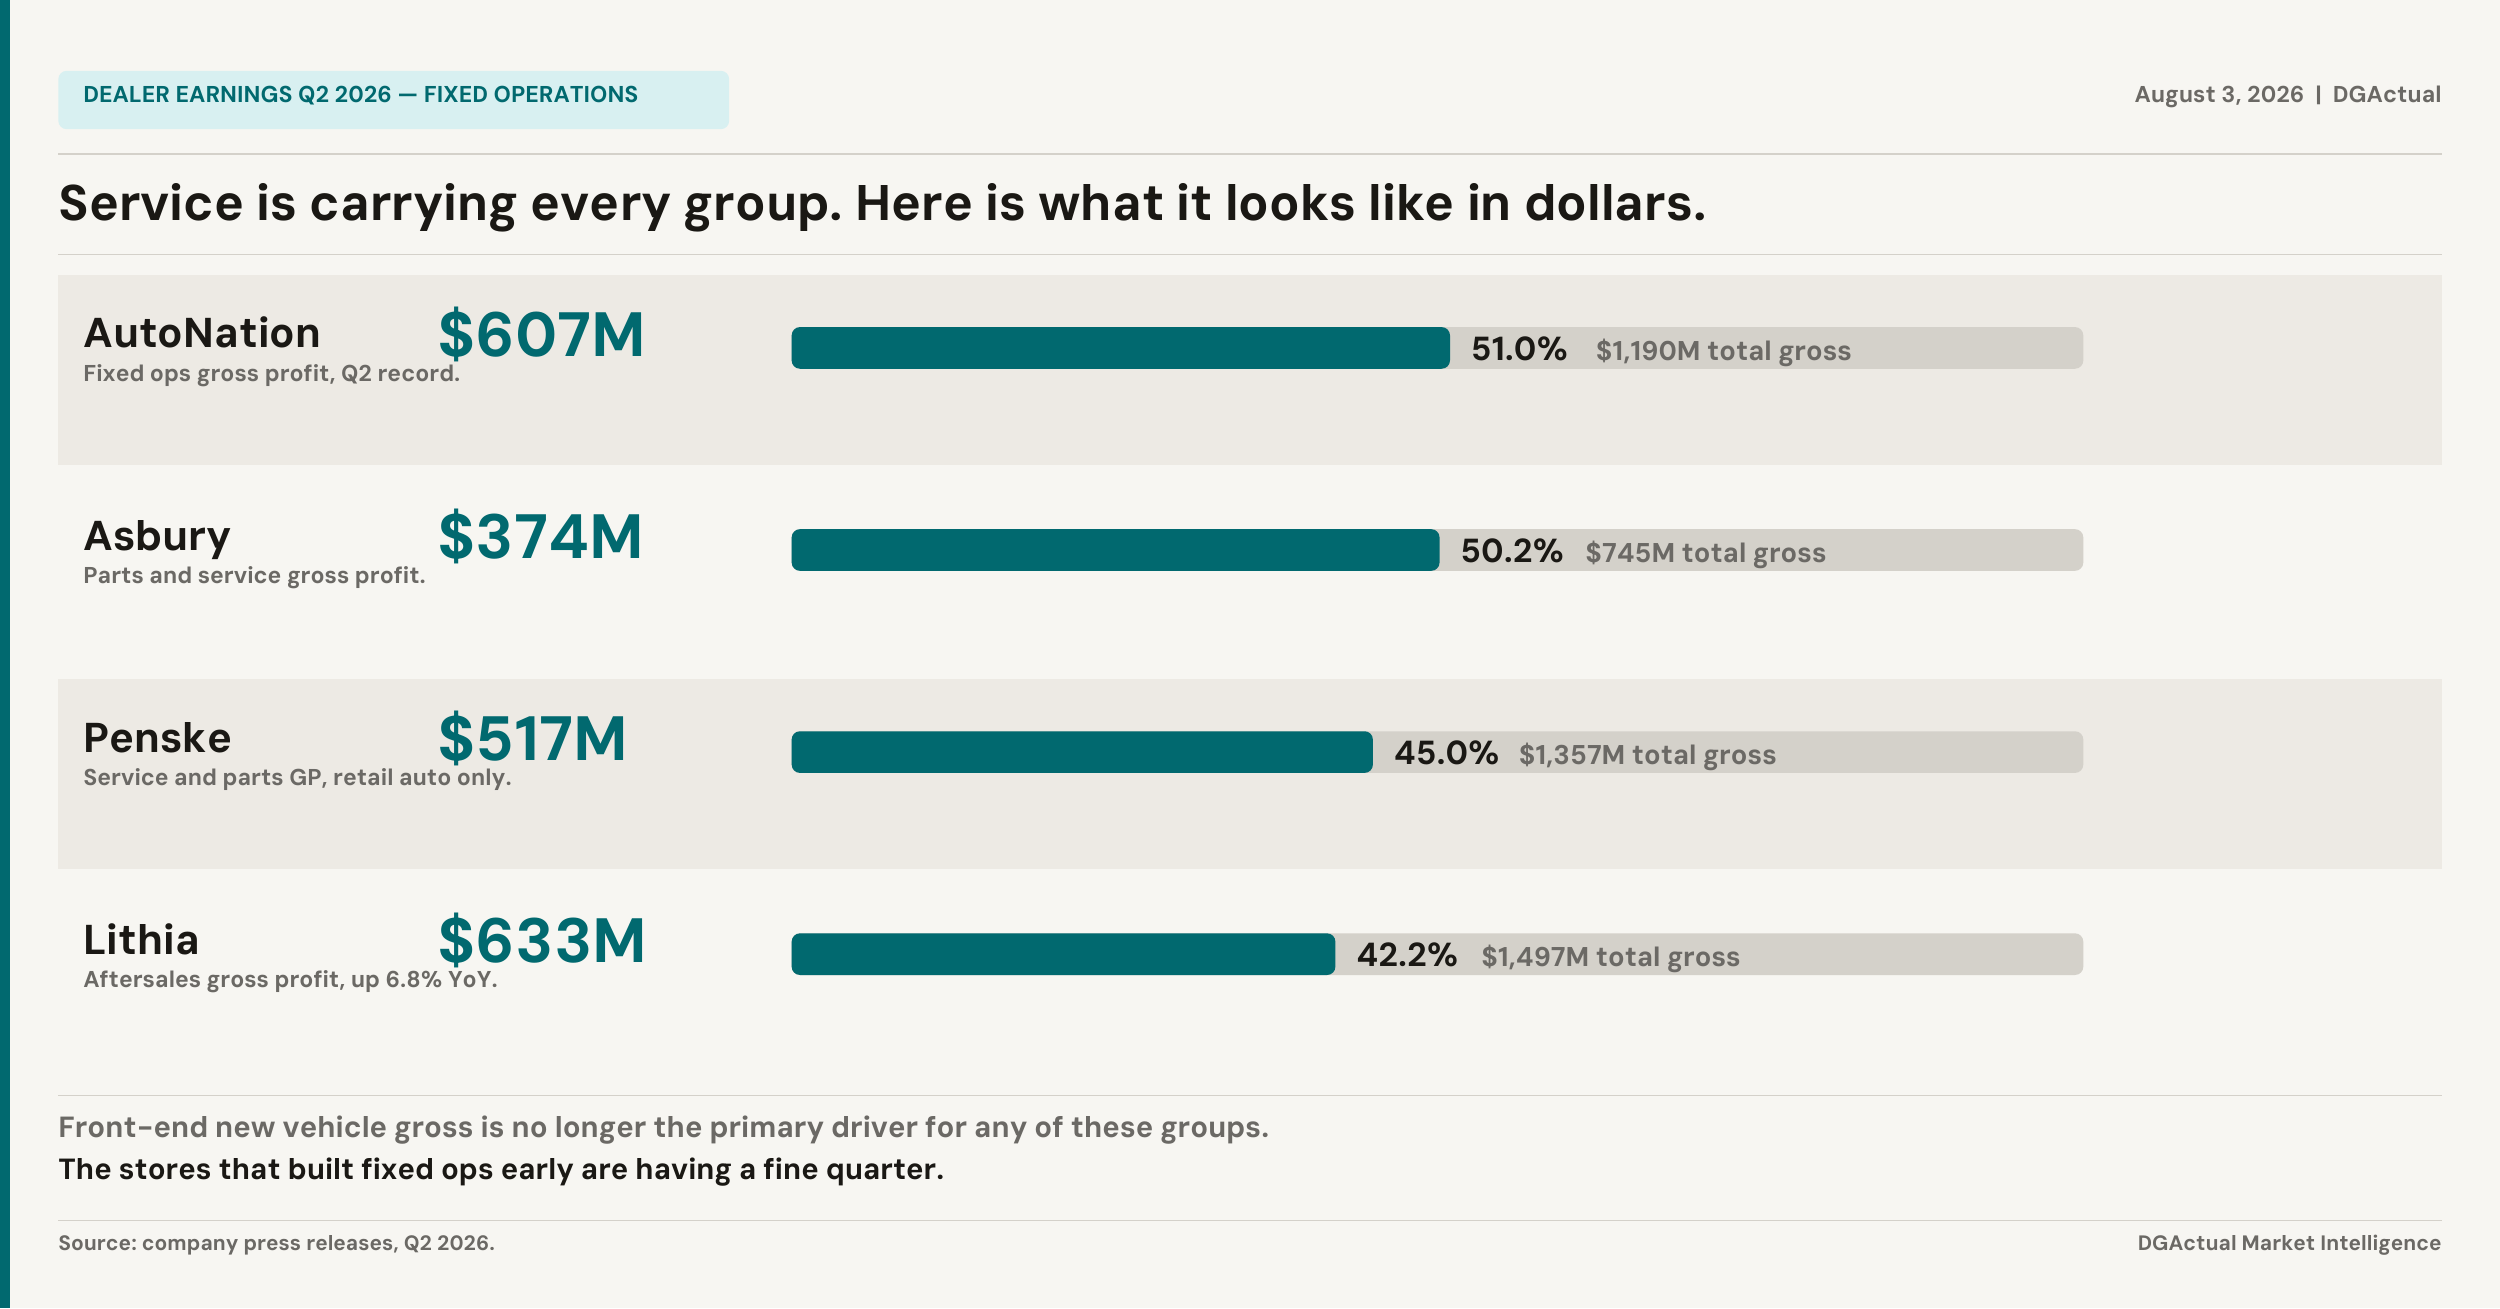
Here's the number to know before you read anything else from Q2. At Asbury Automotive, parts and service now makes up 50.2% of total gross profit. Half. At a company that sells cars.
AutoNation posted $607 million in fixed operations gross profit for Q2, a company record. Penske runs a 59% service and parts gross margin on its retail automotive operations. Lithia grew after-sales gross profit 3.1% on just 1% revenue growth, meaning margins expanded inside service even while top-line revenue barely moved. The pattern holds across every group reporting this quarter.
Stores that invested in service capacity, technician retention, and repair order count years ago are the ones having a strong quarter. Service absorption, the share of a store's total operating expenses that service and parts gross profit can cover on its own, is the clearest indicator of how a dealership is holding up in this environment. Every group reporting well this week runs absorption above 70%. It's worth knowing where your own store sits.
Used vehicles: where the industry is separating
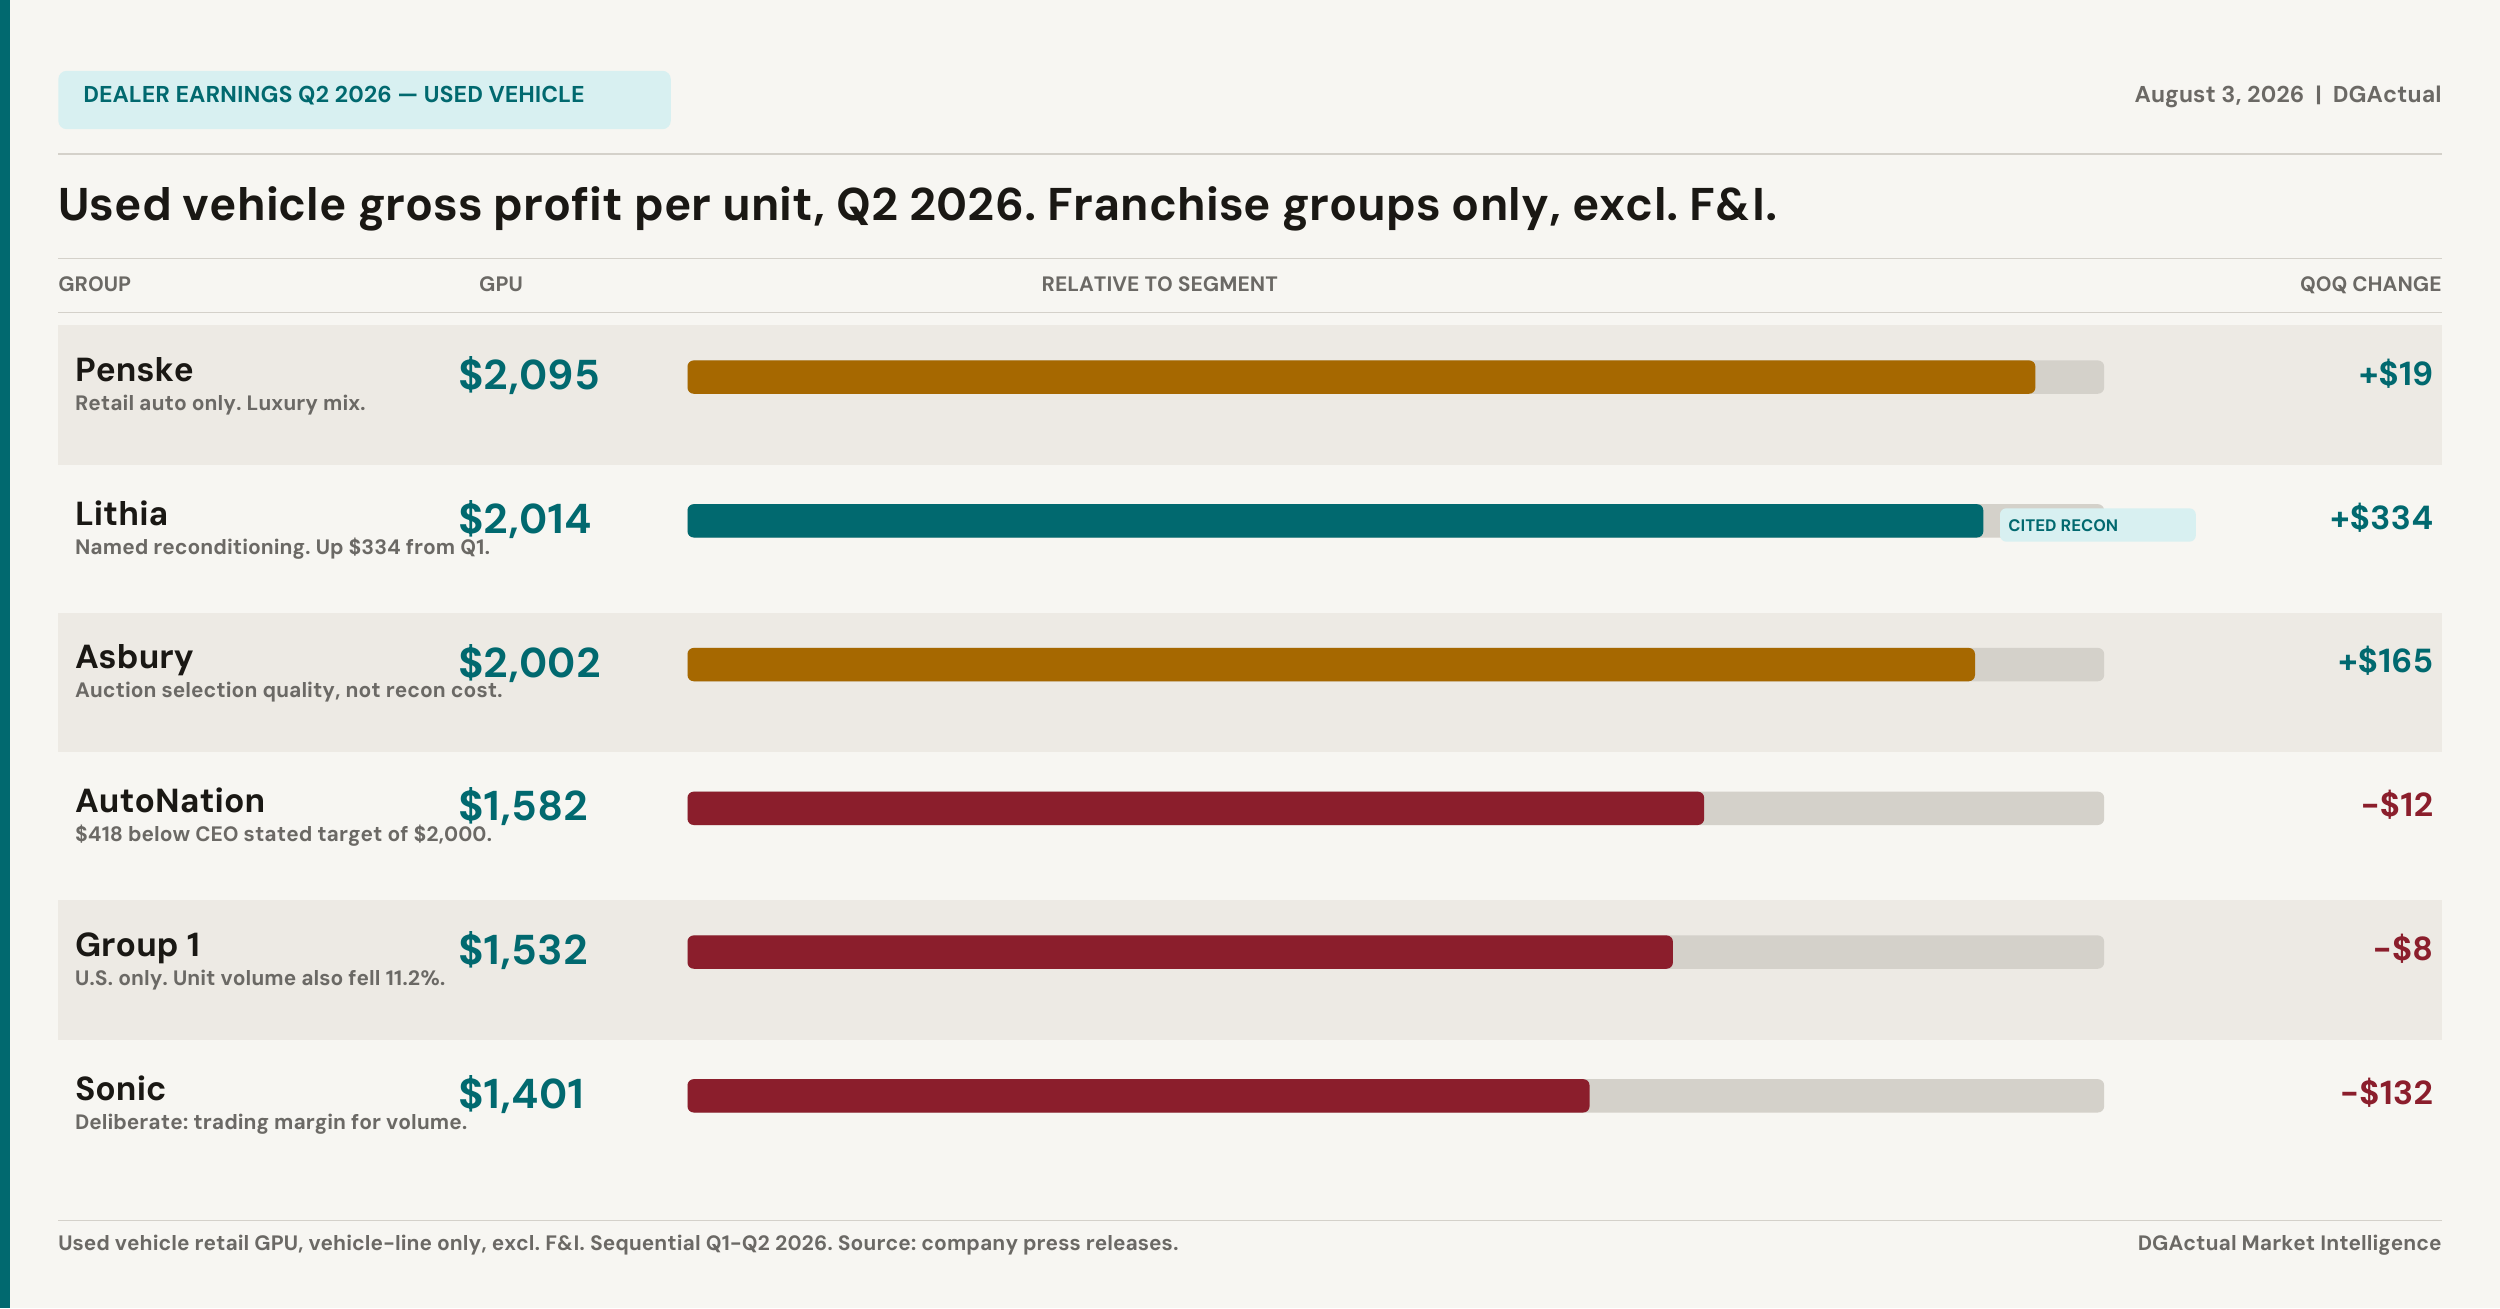
The used vehicle desk is where the gap between the best and the rest is widest right now. Penske is pulling $2,095 per unit. Sonic is at $1,399. That's a $696 spread, and it isn't about who sourced better inventory. It's about how each group handles a vehicle after it arrives.
The groups at the top got there by treating reconditioning, the process of getting a trade-in ready to sell, as something you measure and manage with targets and technology. The groups lower on the list are still treating it as a cost you absorb and move past.
Dealer groups that talked about reconditioning as a managed operational system on their Q2 earnings calls generated $716 of combined sequential used vehicle gross profit improvement per unit. Groups that didn't: $32. Same market. Same quarter. Twenty-two times the result.
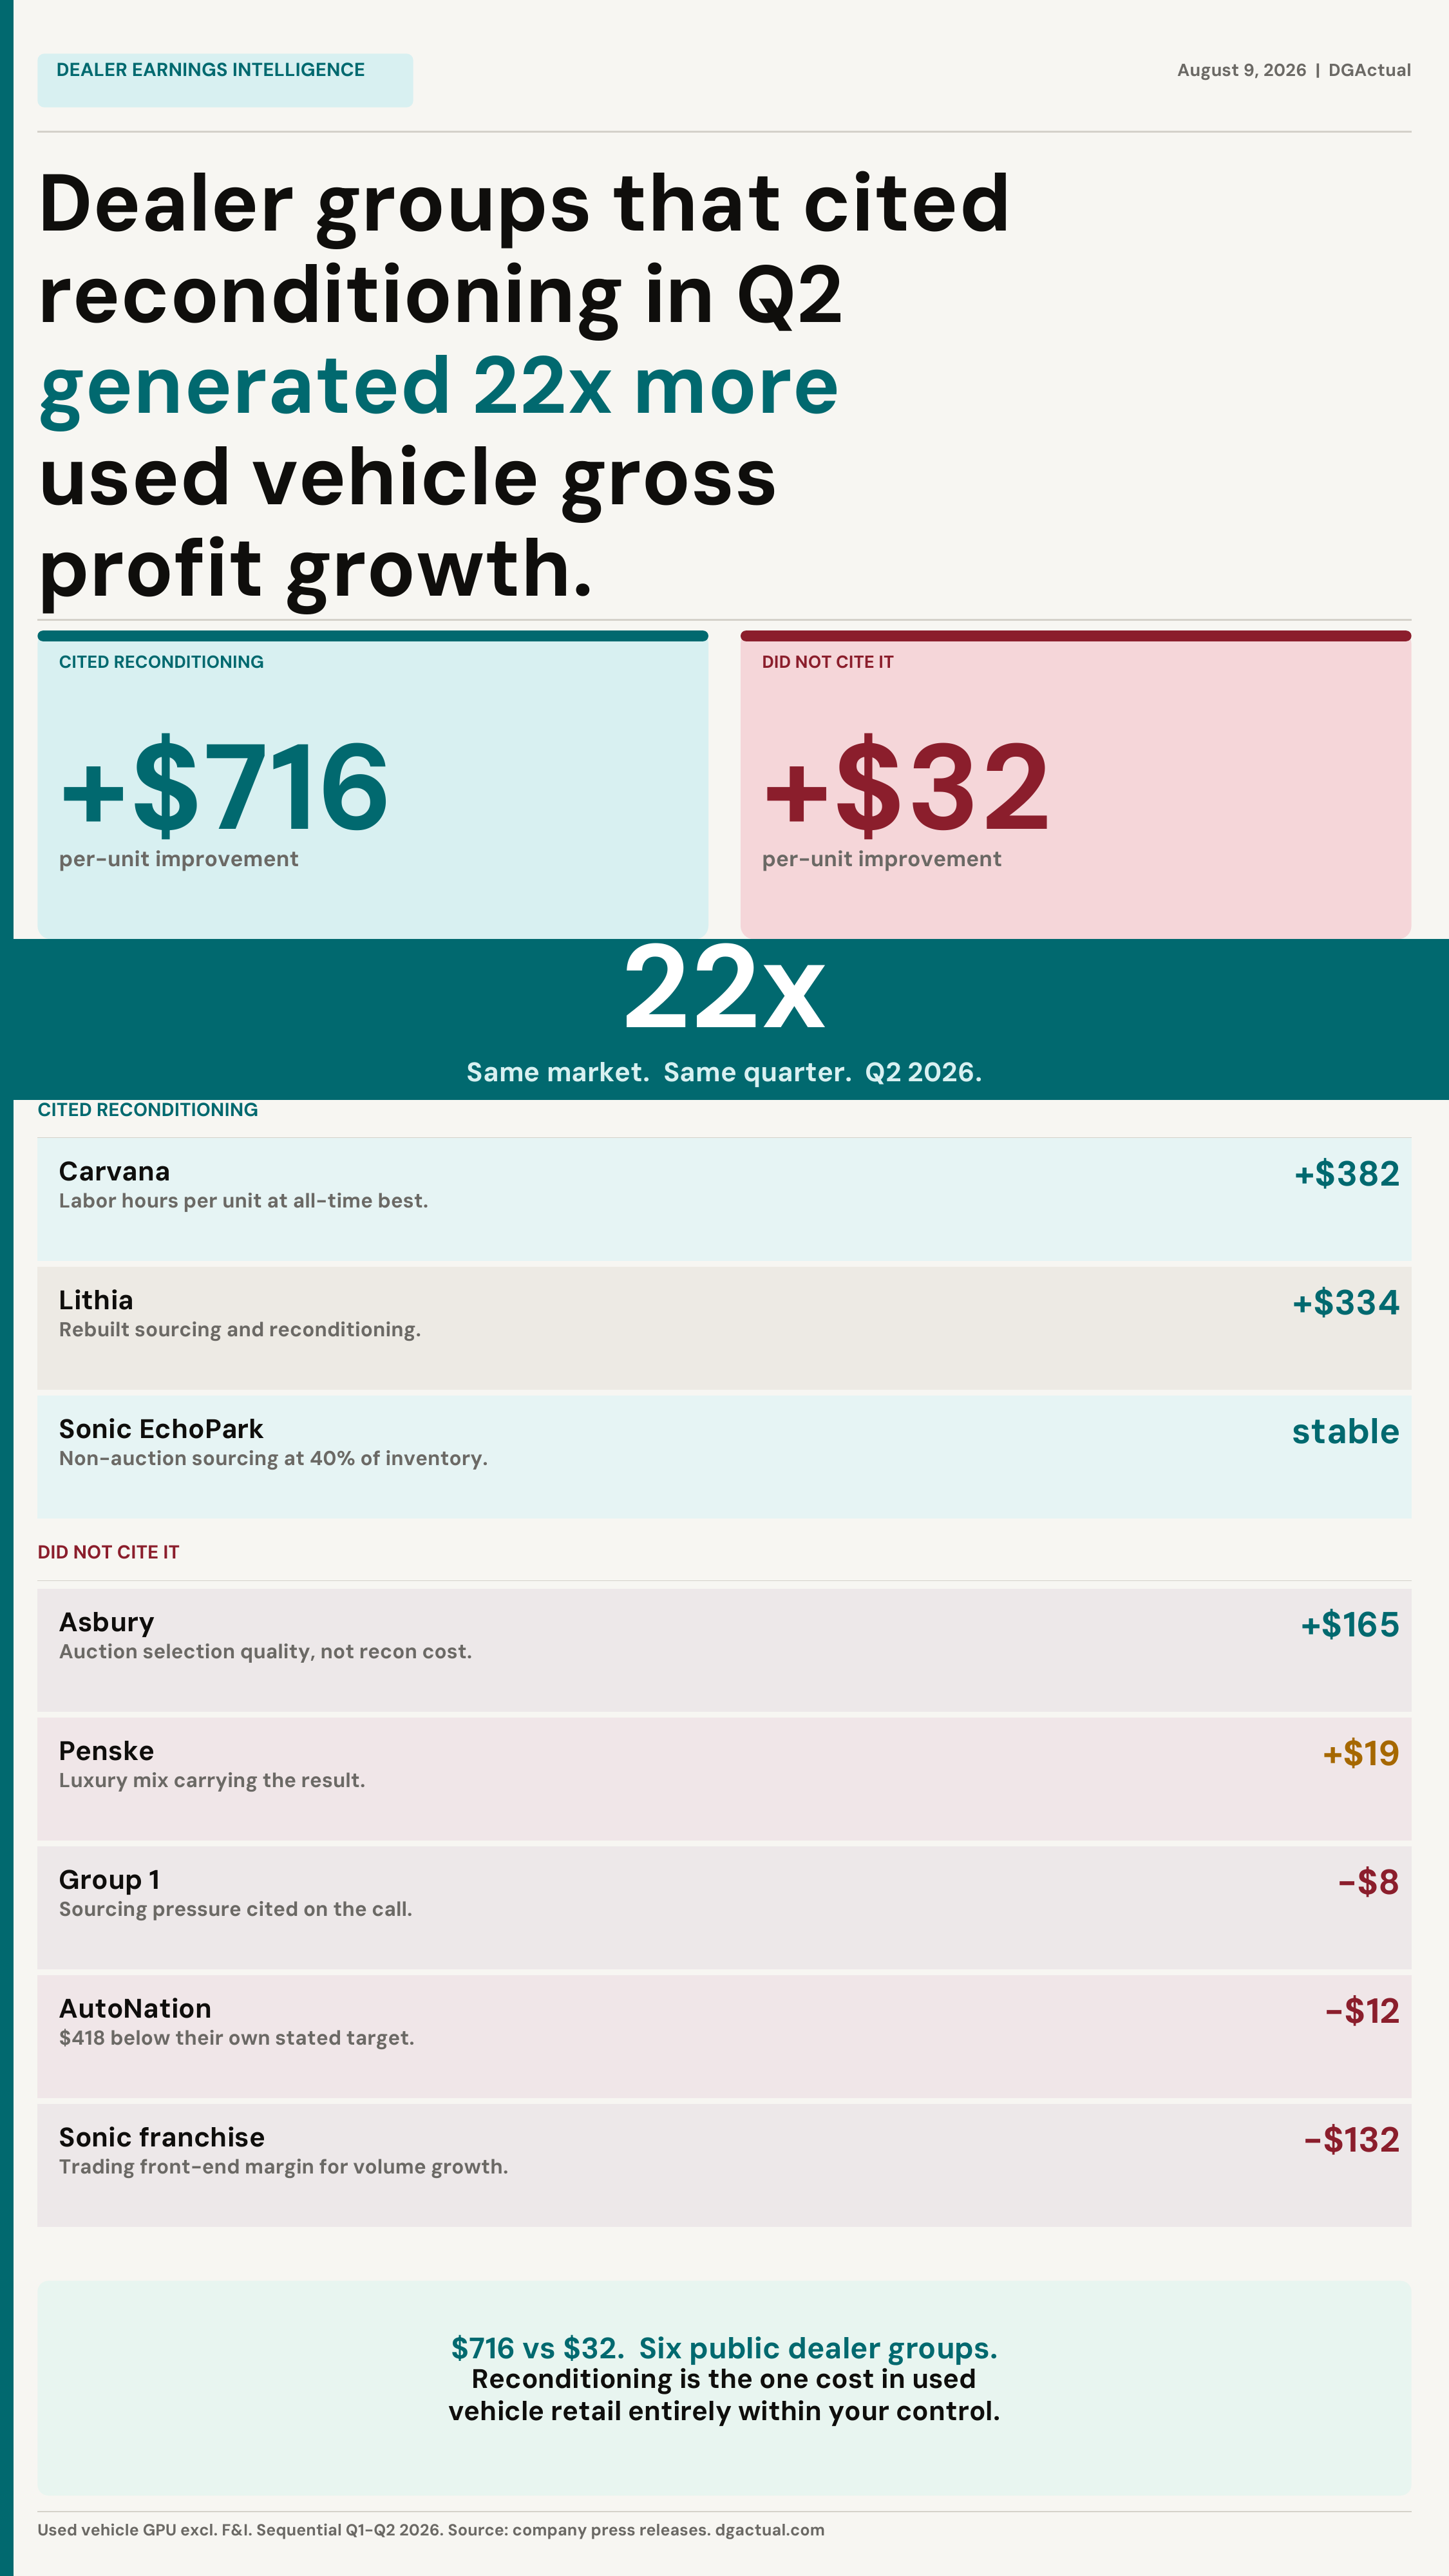
Lithia improved $334 per unit in a single quarter. This is the same company that was down 40% in share price earlier this year, navigating COO turnover and what analysts called mismanaged SG&A expectations. The operational reset worked. They rebuilt used vehicle sourcing, tightened reconditioning discipline, and grew Driveway Finance penetration to 18% at an average FICO of 750. Two consecutive earnings beats and a 14% stock jump in a day confirm the turnaround is real.
AutoNation set a public target in Q1: $2,000 per used vehicle in gross profit. Q2 came in at $1,582. That's a $418 gap against their own stated goal, on the record, in front of every analyst covering the stock. Q3 is a consequential quarter for them. Either the gap closes or the conversation about why it hasn't will define the narrative into year-end.
New vehicles: the floor is being found, but not everywhere
Every group showed new vehicle GPU compression year over year. What matters now is who has found their floor and who is still moving lower.
Lithia has held $2,700 to $2,800 per unit for three consecutive quarters, and management pointed to that stability directly on the call. Group 1 has stayed above $3,250 domestically for three straight quarters. Penske's $4,782 reflects luxury and commercial truck mix more than operational outperformance, but within that mix they're holding.
AutoNation at $2,381 and Asbury at $2,896 same-store are still moving sequentially lower. Asbury is carrying $4 to $5 million in duplicate DMS costs from a Tekion rollout mid-implementation, which is real but temporary friction. Their underlying performance is a little better than the headline number reflects, and that friction clears when the rollout completes.
Year-over-year comparisons are also worth reading carefully, since Q2 2025 captured significant tariff pull-forward demand that inflated new GPU at the time. The cleaner read is sequential: who is holding flat, and who is still compressing. Lithia and Group 1 domestically are holding. AutoNation and Asbury have more work to do.
Key insights from Q2 earnings
International exposure is a liability right now
Group 1's UK operation turned what would have been an on-consensus quarter into an 11.7% EPS miss. The domestic U.S. business performed well. The consolidated result didn't, and it's a clear illustration that cross-border operational complexity is not being rewarded in the current environment. In the same week, Group 1 announced a $1.3 billion acquisition, which is either well-timed confidence in the domestic business or a statement the market hasn't yet agreed with.
Carvana is a specialty finance company that sells cars, not the other way around
$703 million of Carvana's H1 2026 gross profit came from gain-on-sale of auto loans. The retail vehicle business generated $593 million in Q2. The financing arm generated $526 million. Reading their gross margin like a car dealer's gross margin produces the wrong conclusion. Their 20% margin is structural, built on proprietary reconditioning infrastructure and a logistics model that wasn't designed to be replicated through operational adjustments alone. It's a different kind of business, not a better-run version of the same one.
The captive finance advantage is compounding in a 29.6% negative equity environment
Almost a third of new vehicle buyers in Q2 rolled in an underwater trade, carrying an average of $6,884 in negative equity. That customer needs a lender who can structure a deal flexibly, something standardized third-party underwriting usually won't do. AutoNation Finance grew its portfolio from $2.4 billion to $2.7 billion this quarter. Driveway Finance, Lithia's captive operation, originated at record levels. Captive finance is closing deals that would otherwise not close. The credit risk is real, and so is the competitive position it's building.
Penske's commercial truck tailwind is doing real work in the headline numbers
Penske's Premier Truck Group sold 5,431 commercial trucks in Q2 at a used truck GPU of $8,923, driven by freight market recovery rather than automotive retail dynamics. Strip the trucks out and Penske's retail automotive gross margin was 15.8%, down from 16.9% a year ago. The 59% service and parts margin in their results is also the margin on service revenue specifically, not service as a percentage of total company gross. The numbers are accurate, but the context changes how they read.
Canada tariff August 19: 23 days from today
The additional 50% ad valorem duty on certain Canadian-origin products takes effect at 12:01 AM ET on August 19. The affected product list is in Annex II of the White House proclamation. Canadian assembly plants are a meaningful part of North American production across Ford, GM, Honda, and Toyota lines. If you have Canadian-sourced new vehicle orders in your pipeline, your OEM rep can tell you exactly which VINs are on the affected list. There's time to have that conversation before month end, and it's worth having.
Dealer reviews: 27.5 million Google ratings across 17,814 stores
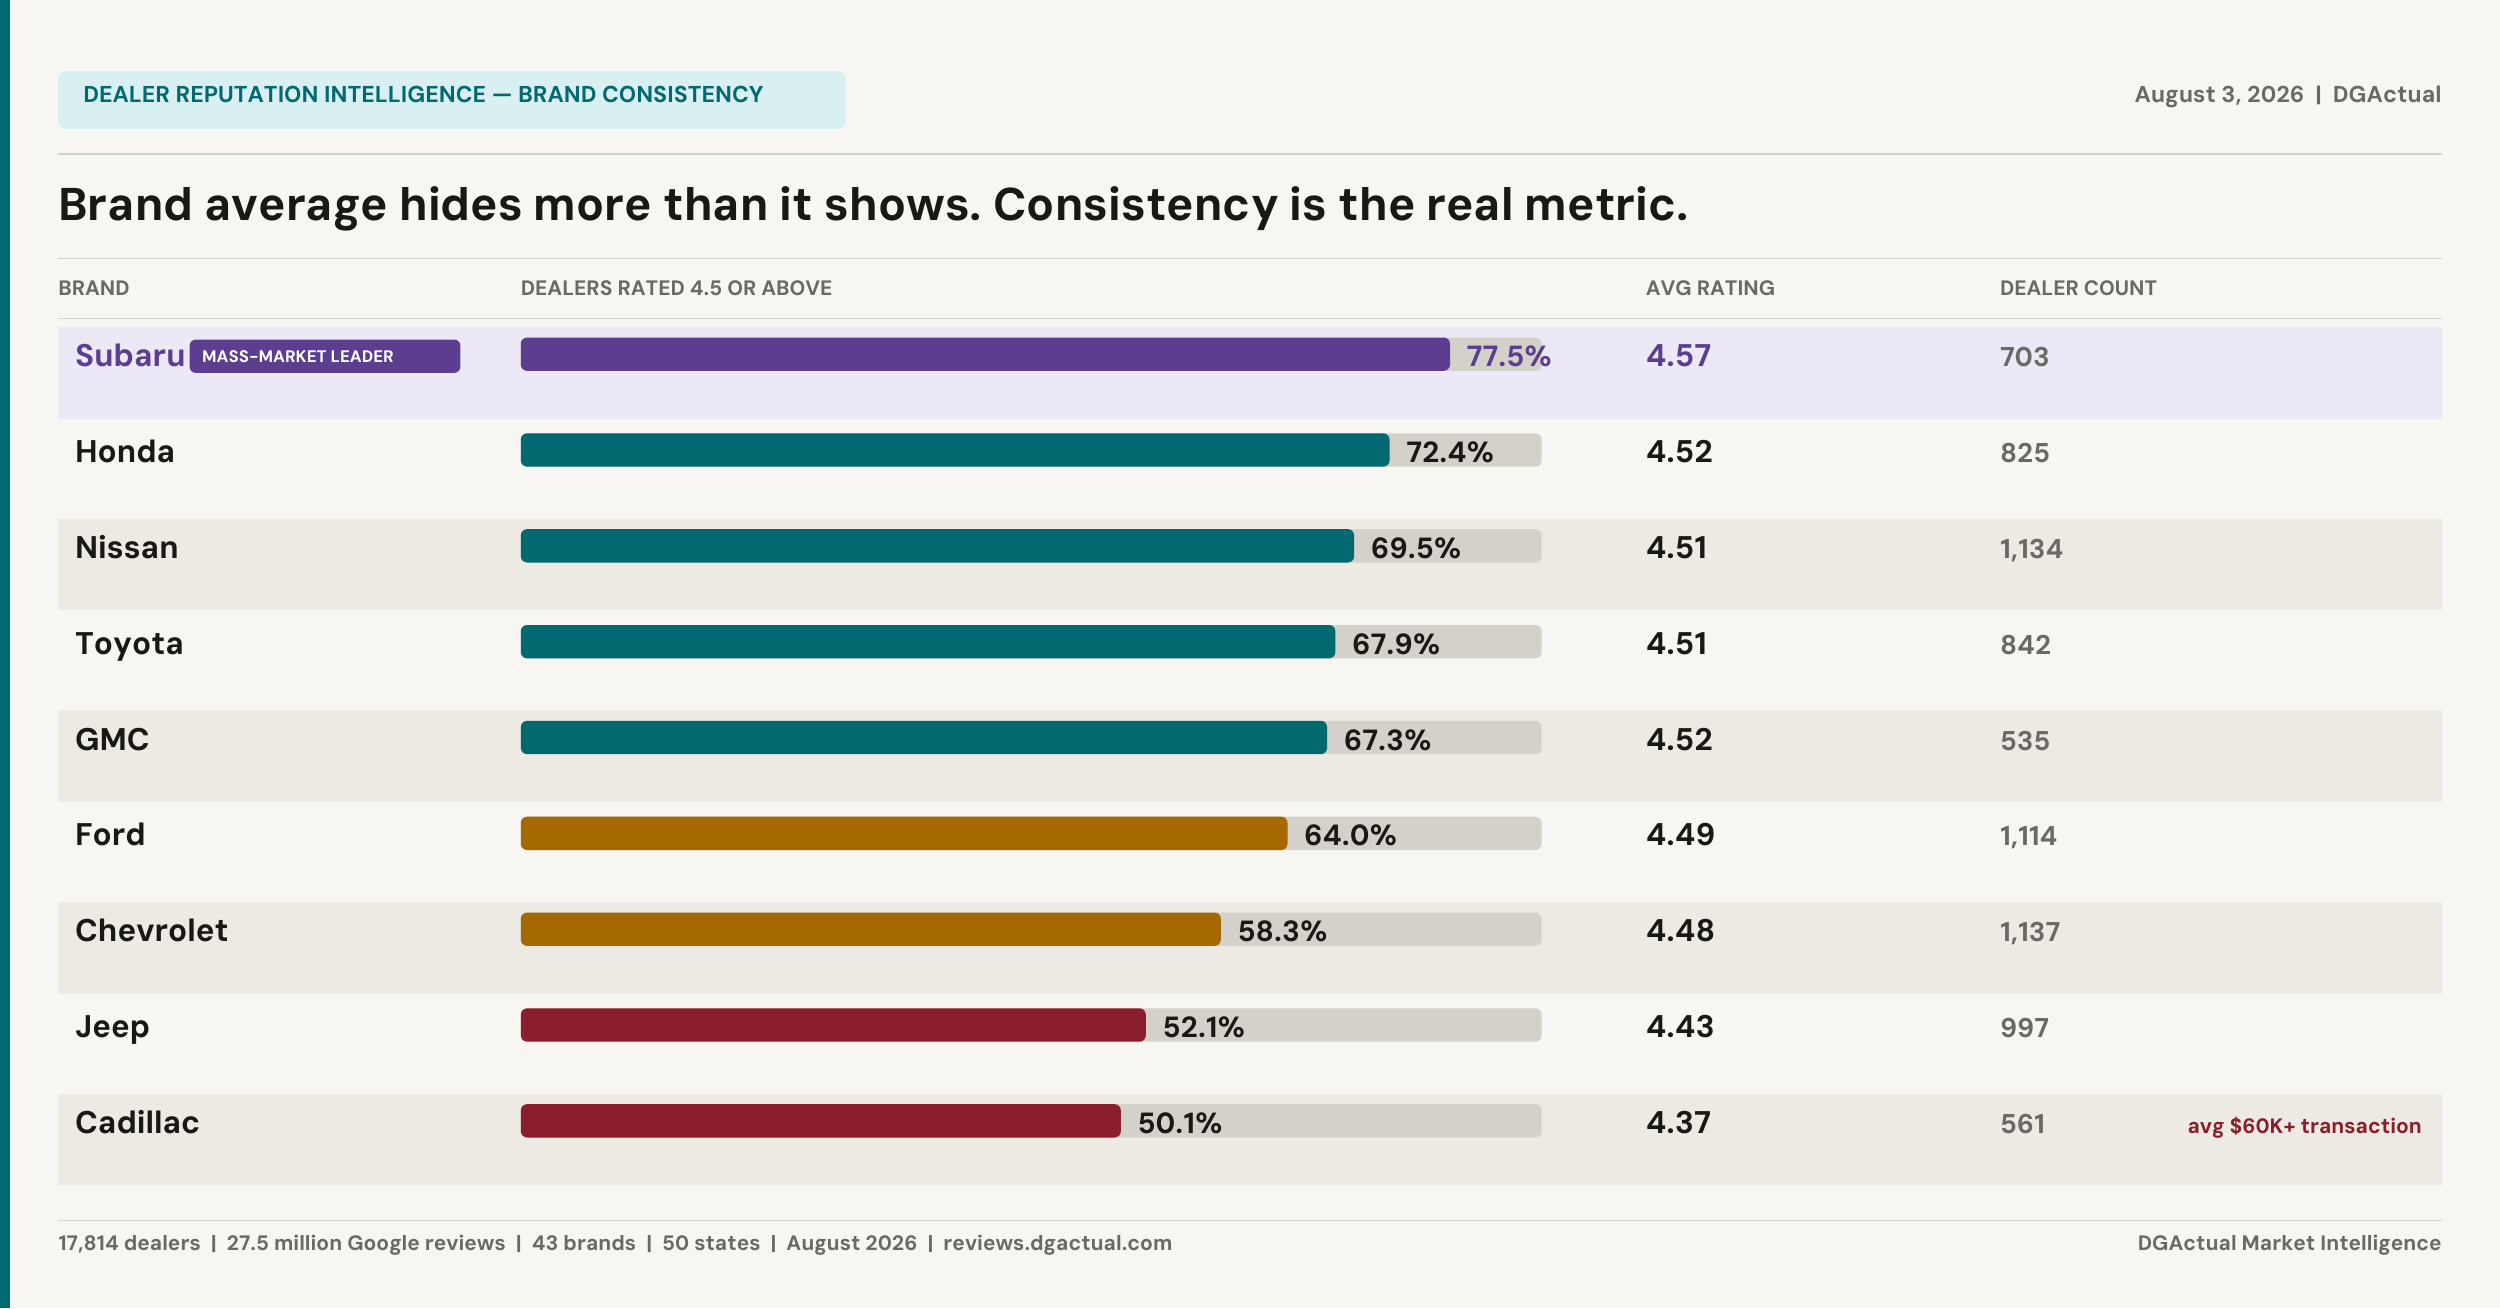
DGActual tracks Google ratings for 17,814 U.S. dealerships across 43 brands in all 50 states. The August refresh just completed. Here's what it shows.
The median dealer rating is exactly 4.5. That sounds solid until you consider that 64% of dealers are already at 4.5 or above. In a market this compressed at the top, a 4.3 doesn't land as pretty good. It reads as a noticeable gap next to a wall of 4.5s. A customer comparing three stores at 4.6, 4.5, and 4.3 is not weighing them equally. The difference registers.
The brand story is about distribution, not averages. Honda and Toyota both average 4.52, but 72% of Honda dealers sit at 4.5 or above, and Subaru actually leads every mass-market brand at 77.5%. Jeep sits at 52%. The averages look similar. The distribution says the experience of walking into those stores is genuinely different. At a Honda dealer, roughly 7-in-10 visits result in a 4.5-plus experience. At a Jeep store, it's closer to a coin flip. That variance shows up in individual store traffic and customer retention well before it surfaces in any OEM reporting.
There's also a notable luxury expectation gap. Cadillac transactions average $60,000 to $80,000 and only 50% of its dealers are rated 4.5 or above. Alfa Romeo has the widest spread between price point and consistency: nearly 20% of its dealers sit below 4.0. Porsche, Acura, and Subaru are the consistency leaders across all 43 brands tracked.
Geography plays a real role too. South Carolina dealers average 4.60. California dealers average 4.40. That 0.20 gap is consistent with a broader pattern: markets with longer customer tenure and more repeat business outperform high-turnover, high-competition markets. California's 442 dealers average 4.40, with only 47% above 4.5, the weakest result among large states in the dataset.
And on the 5.0 rating: 473 dealers have one. Only 36 have more than 100 reviews. Only 7 have more than 500. At scale, a perfect rating is most often a reflection of sample size rather than an extraordinary operation. Somewhere around 500 reviews is where context starts to matter more than the number itself.
Full interactive data at reviews.dgactual.com.
Month over month: what actually moved
Comparing July 2026 to August 2026 across 17,045 dealers and 43 brands, the story is stability. 93.4% of dealer ratings moved less than 0.04 points in either direction. Month-to-month movement in Google ratings is inherently gradual, and this month reflects that.
The brands worth watching are at the edges. Maserati saw a meaningful decline across 68 dealers, down 0.009 points, with 8.8% of its stores declining. Alfa Romeo moved the same direction, down 0.003 points, with 7% of its dealers declining against only 4.5% improving. Both are worth watching as early signals of customer experience trends that often take longer to surface in other data sources.
BMW is the standout on the positive side: up 0.004 points across 515 dealers, with a 3-to-1 ratio of improving stores to declining ones. At that scale and dealer count, that's a consistent and meaningful result.
At the individual store level, one California Mercedes-Benz store posted the largest single jump in the dataset, from 3.3 to 4.5, a 1.2-point gain, while also adding 1,597 new reviews in a single month. The largest volume gain in the data by a wide margin. Something changed at that location, and the reviews reflect it quickly.
On the other end, a Louisiana Kia store declined from 4.2 to 3.8, a 0.4-point drop on a base of 868 reviews. At that review count, that's a real and visible shift in the customer experience signal.
Longo Toyota in California and Mike Calvert Toyota in Texas are leading the data in new review volume gains. Consistent review collection tends to produce rating stability over time, because a larger sample is less susceptible to being moved by a small number of new ratings in either direction.
Most of the market held steady. The stores and brands that moved are the ones worth keeping an eye on heading into September.
DARPI: three consecutive weeks of used vehicle price softening
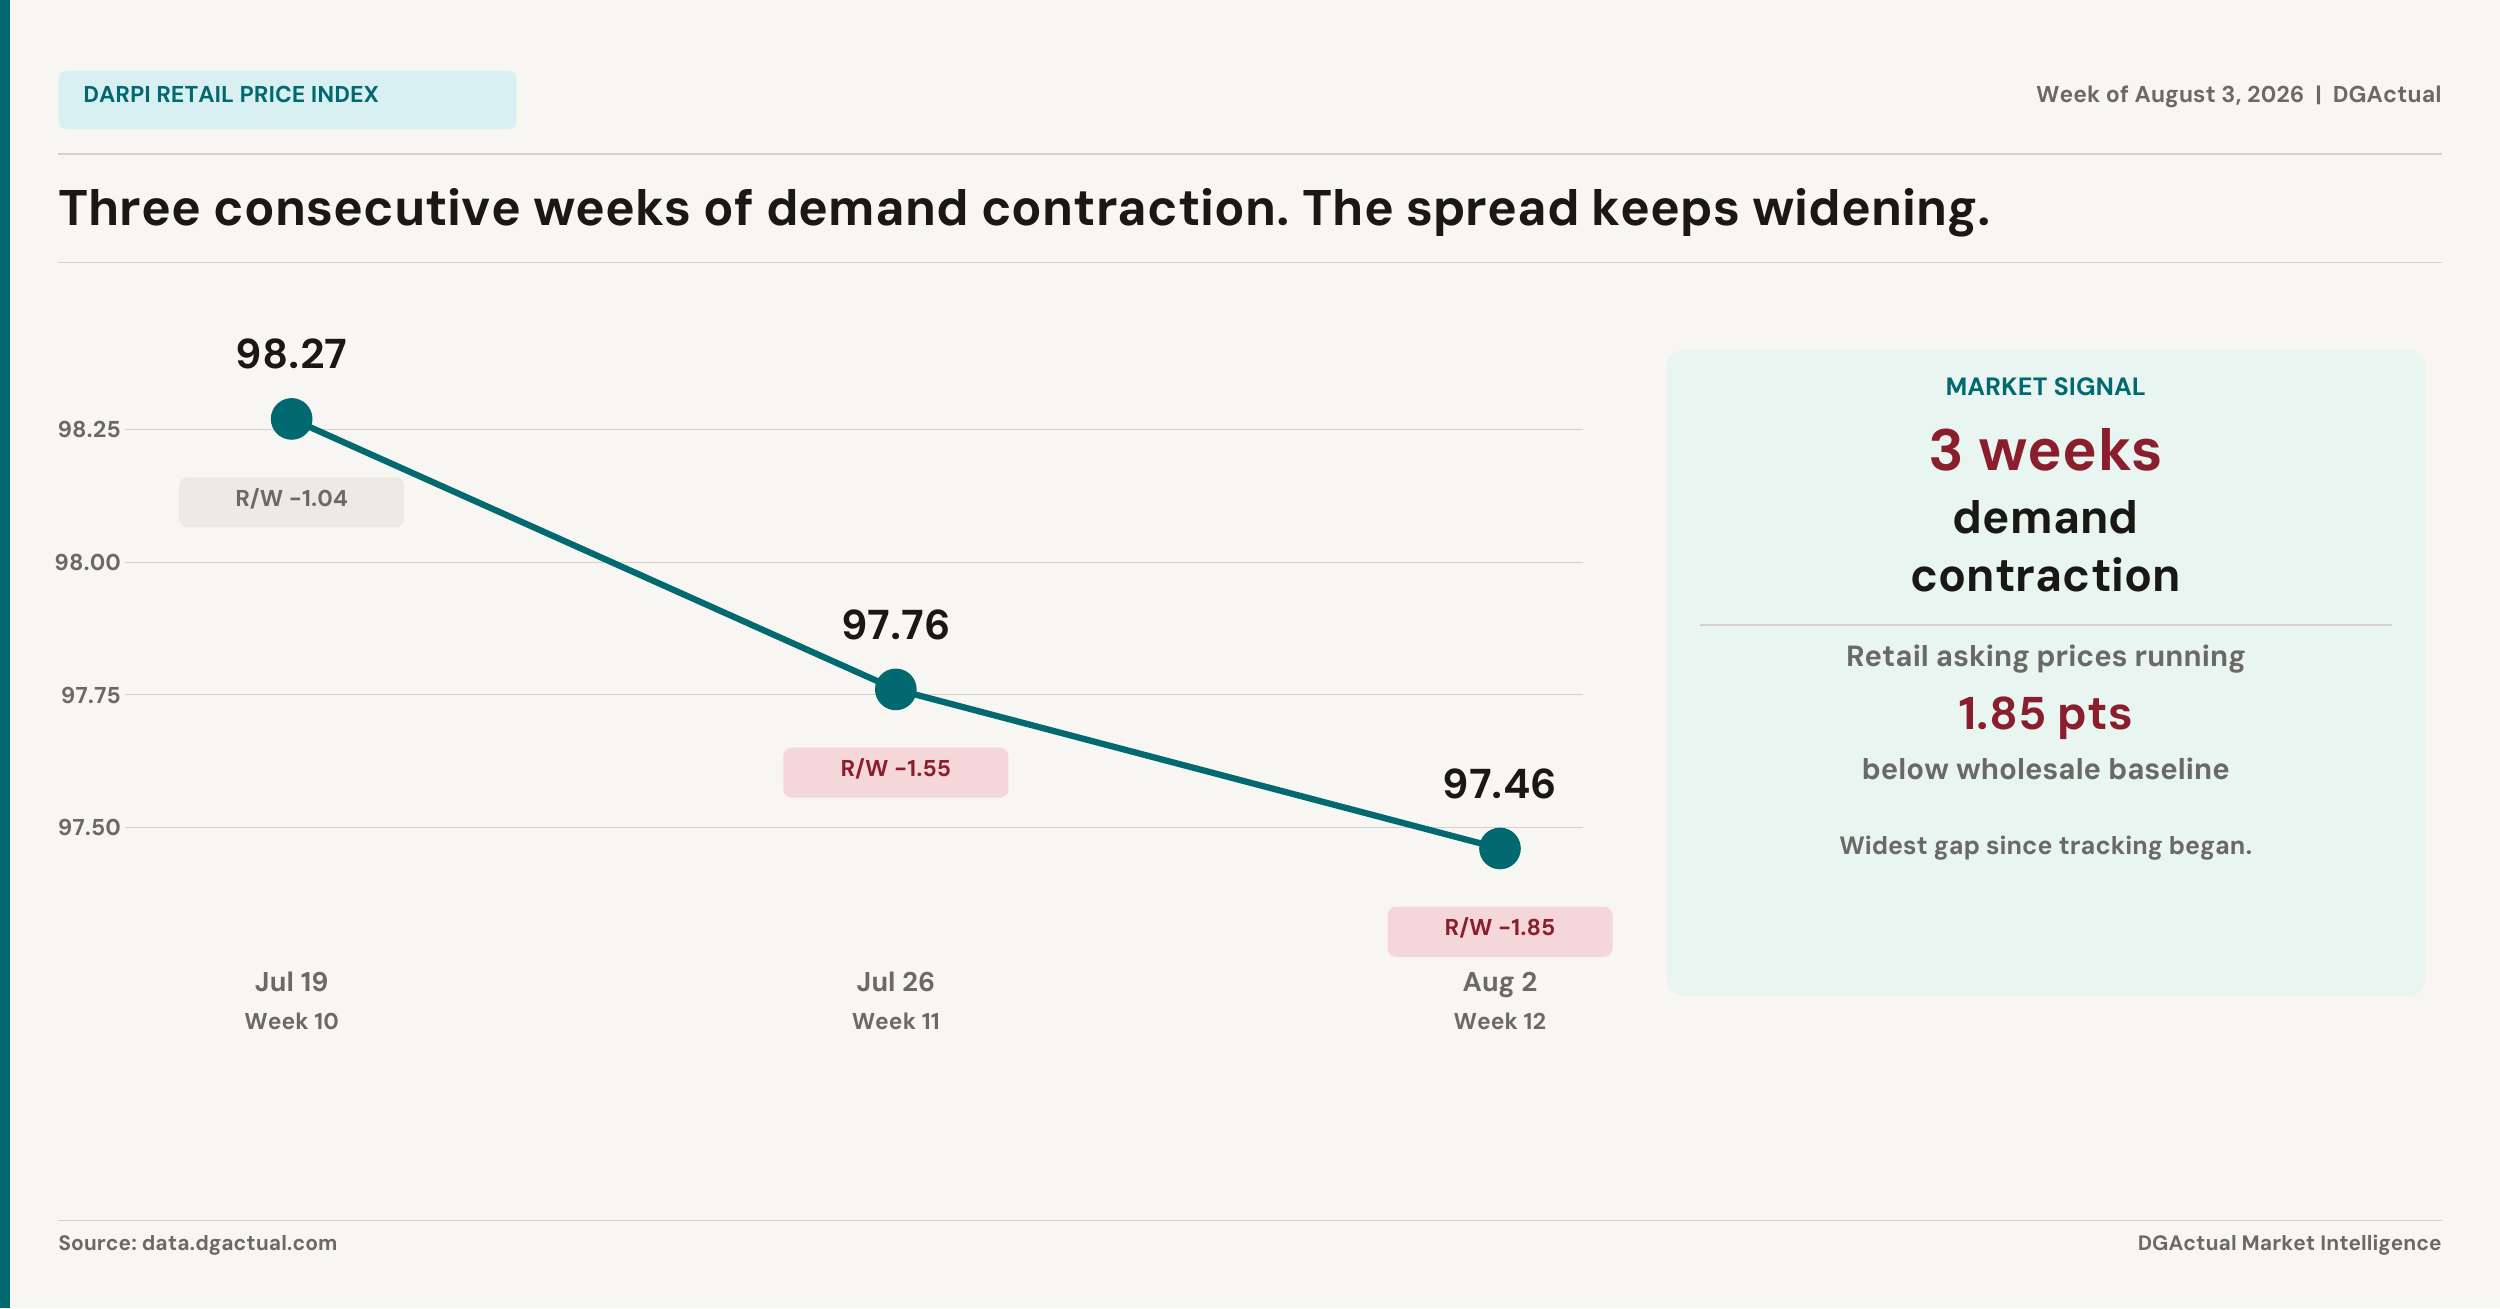
DARPI stands for DGActual Automotive Retail Price Index. It tracks retail asking prices across 11 vehicle segments on a weekly basis, normalized against a baseline so that movement over time is immediately readable. A score of 100 is the baseline. Above 100 means prices are elevated relative to that baseline. Below 100 means prices have softened from it. The index also tracks DARVI, the volume component, and the retail-to-wholesale spread against an industry wholesale benchmark.
The index has now recorded demand contraction for three consecutive weeks. The composite Near-New index fell from 98.27 on July 19 to 97.46 on August 2, a 0.81 point decline over three weeks. The retail-to-wholesale spread has widened from negative 1.04 to negative 1.85, the largest gap since the index began tracking.
Retail asking prices are running below where the wholesale benchmark sits, and that gap is widening each week. Wholesale is holding. Retail isn't keeping pace. Stores pricing appraisals and trade acquisitions off data from three weeks ago are acquiring above today's market, and that gap shows up in inventory aging and margin compression before it shows up anywhere else.
This week's biggest segment moves
Fullsize SUV fell the most: $52,716 median, down $621 from last week. The 2023 Chevrolet Tahoe and 2024 Ford Expedition lead the segment by volume. 98 days average on lot. Supply remains plentiful here.
Minivan: $28,235, down $320. 65 days average days on lot, the fastest non-Tesla segment tracked this week.
Full Pickup: $41,559, down $147. 118 days average on lot. Trucks are sitting over four months, the longest reading in the current data set.
Electric Vehicle: $33,347, down $110. Tesla Model Y and Model 3 continue to lead both volume and velocity at 35 to 38 days. The segment median is pulled toward 75 days by non-Tesla EVs sitting considerably longer. Pricing strategy should reflect which of those two situations applies to any given unit.
Compact Car, Compact SUV, and Midsize Car held essentially flat, moving less than 0.03 index points in either direction.
Full segment data, model-level breakdowns, and the FSBO acquisition desk update weekly at data.dgactual.com.
Acquisition desk: private seller signals this week
Private seller data from MarketCheck as of August 3, 2026. The acquisition desk looks at where private sellers are pricing relative to dealer retail, and how long their listings are sitting, to identify which models represent realistic buy-center opportunities and which ones to approach with patience.
Best opportunities right now
Honda Accord (2022-2025): Private sellers are asking $21,940 against a dealer median of $24,998. That's a $3,058 spread in the dealer's favor, meaning the right Accord at private-party asking price, reconditioned and retailed, still has room. Dealers have units sitting 73 days. Private sellers are at 74 days. No urgency gap, but the price spread is real.
Toyota Camry (2022-2025): Private sellers asking $21,850 against dealer retail of $23,995. A $2,145 spread. Private sellers are also sitting 39 days longer than dealers, 107 days versus 68. That combination, price above dealer cost and listings aging, is the profile of a motivated seller who hasn't adjusted yet.
Toyota RAV4 (2022-2025): Private sellers at $28,500 against dealer retail of $29,625. A $1,125 spread with essentially the same DOM on both sides. Not a dramatic opportunity but a clean one, with the volume to find good units consistently.
Tesla Model Y (2022-2025): Private sellers asking $29,890 against dealer retail of $30,600. A $710 spread, and private sellers are sitting 124 days against dealer DOM of 37. That's an 87-day gap. The seller who listed a Model Y in April and hasn't moved it is now well into the territory where motivation to deal is real.
Models to watch with patience
Ford F-150 (2022-2025): Private sellers are asking $40,500 against dealer retail of $38,056. Sellers are $2,444 above the dealer market. With 129 days average on private listings versus 123 days for dealers, neither side is moving fast. Trucks are sitting everywhere right now. The F-150 private seller who is anchored above dealer retail will eventually move, but there's no urgency signal yet.
Jeep Grand Cherokee (2022-2025): Private asking $29,950 against dealer retail of $28,708. Sellers are $1,242 above the market and sitting 163 days on average. That's a long time. The Grand Cherokee private seller is often someone who has emotional attachment to their price point. Patience is the right posture here, and the inventory will come.
Full FSBO acquisition data and model-level trends are updated weekly at data.dgactual.com.
Sources: Company press releases (Asbury, AutoNation, Carvana, Group 1, Lithia, Penske, Sonic), Finnhub, Reuters, J.D. Power/GlobalData via CBT News, Federal Reserve, MarketCheck. DGActual Market Intelligence. Week of August 3, 2026.