 DGactual
The Price Held, the Payment Did Not: Fed Splits, Service Keeps Growing, DARPI Slides Again | Week of November 2, 2026
The October sticker barely moved while the monthly payment set a record, the Fed held with two votes to raise rates, and public dealer groups show service as the one department still growing, barely. DARPI logged its sixteenth straight decline.
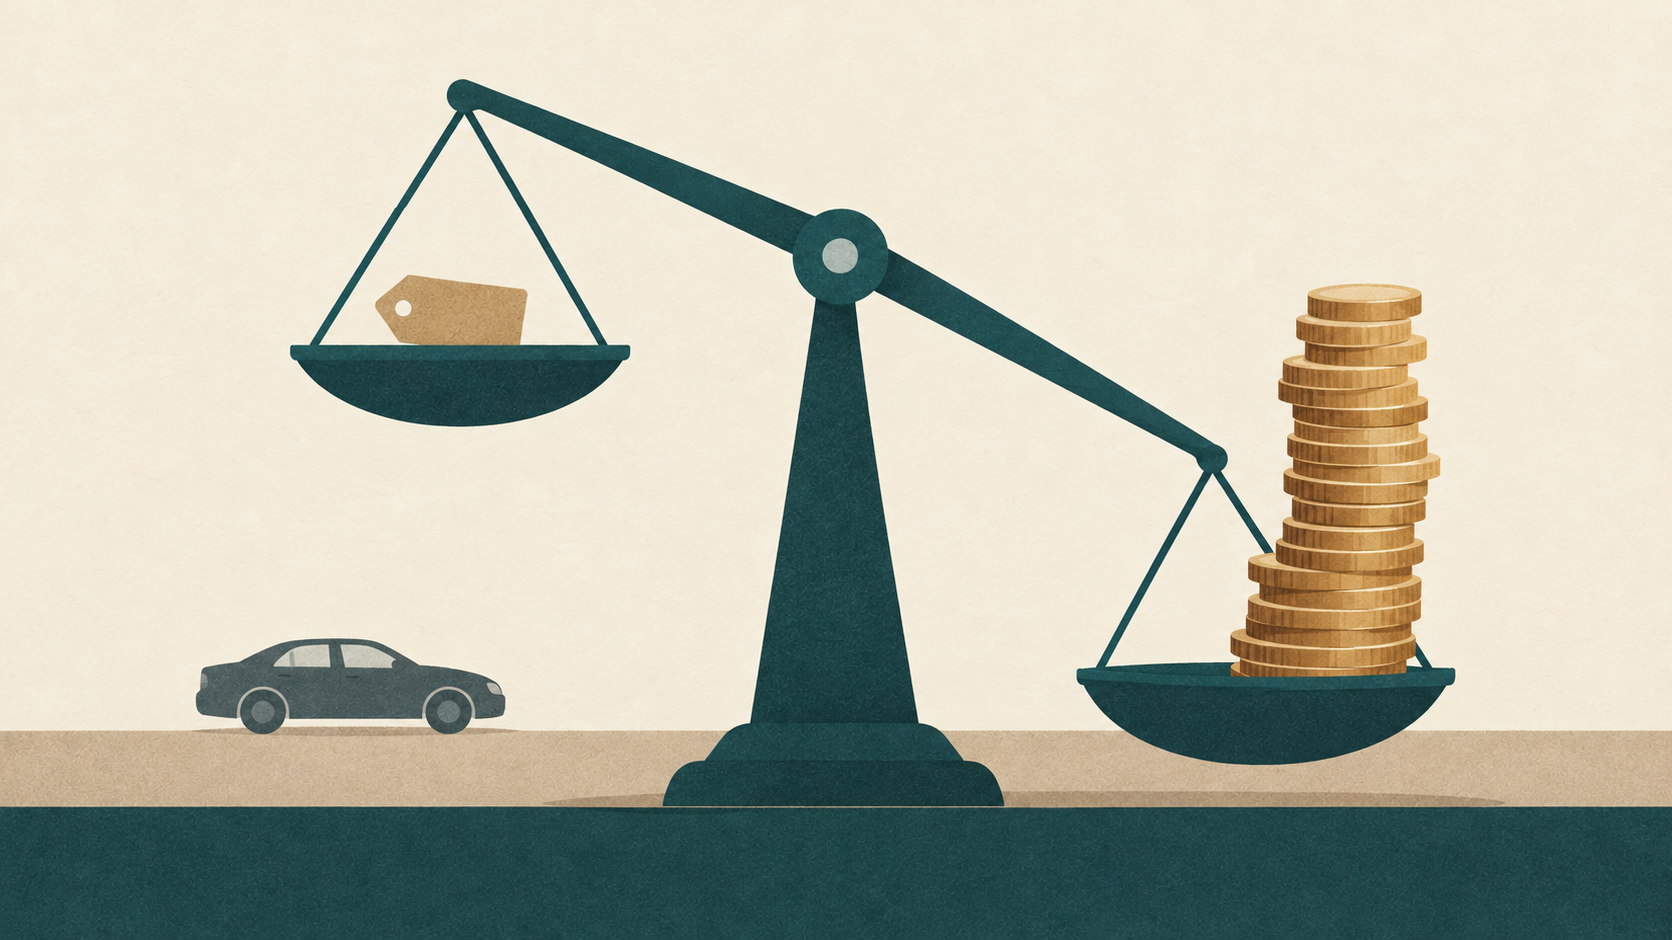
A new car costs about the same as it did a year ago, and the monthly payment on it just set an October record. J.D. Power forecasts October's average transaction price at $46,329, down 0.1%, while the average monthly payment climbs 2.6% to $823. J.D. Power points to financing: a 6.81% loan rate, and the 29.6% of trade-ins that owe more than the car is worth. Meanwhile the Fed held rates with two officials voting to raise them, the economy grew at a 3.4% pace, and consumers rate their own mood at 48.0. Cheaper cars are leaving dealer lots faster than they were in the spring, and our used price index has now slipped sixteen readings in a row.
Overview
Here is the week in one breath. The Fed held at 3.75% to 4.00% on a 10 to 2 vote, and both dissenters wanted a hike. Third-quarter growth came in at 3.4%, September inflation ran 3.6%, and consumer sentiment sat at 48.0. In new cars the price held and the payment did not, and cheaper cars are spending fewer days on dealer lots. DARPI, our read on used retail asking prices from dealer listings, fell to 93.42 on its sixteenth straight decline, now 6.58 points under where it started.
Inside the public dealer groups, service is the one department still growing, though barely, and the finance office is losing ground. Our FSBO (for sale by owner) read flags four private-seller discounts that hold up once mileage is matched. The monthly Dealer Reputation Scoreboard refresh shows how little moved. We close with the calendar, because Tuesday is Election Day and Friday brings the jobs report.
The Fed Split
The Federal Reserve left its target range at 3.75% to 4.00% on Wednesday, October 28, and the vote was 10 to 2. The two who disagreed, Governor Lisa Cook and Cleveland Fed President Beth Hammack, each preferred to raise rates by a quarter point. The statement now says economic activity is expanding at a strong pace and that inflation remains elevated, according to the Federal Reserve's own release.
The data that landed the next day points both ways. The Bureau of Economic Analysis put third-quarter growth at 3.4% at an annual rate, up from 2.2% in the second quarter. Its personal consumption expenditures report, the inflation gauge the Fed prefers, showed September prices up 3.6% over twelve months, with core, which strips out food and energy, at 3.1%. It is the picture facing a committee where two members had already voted to raise rates.
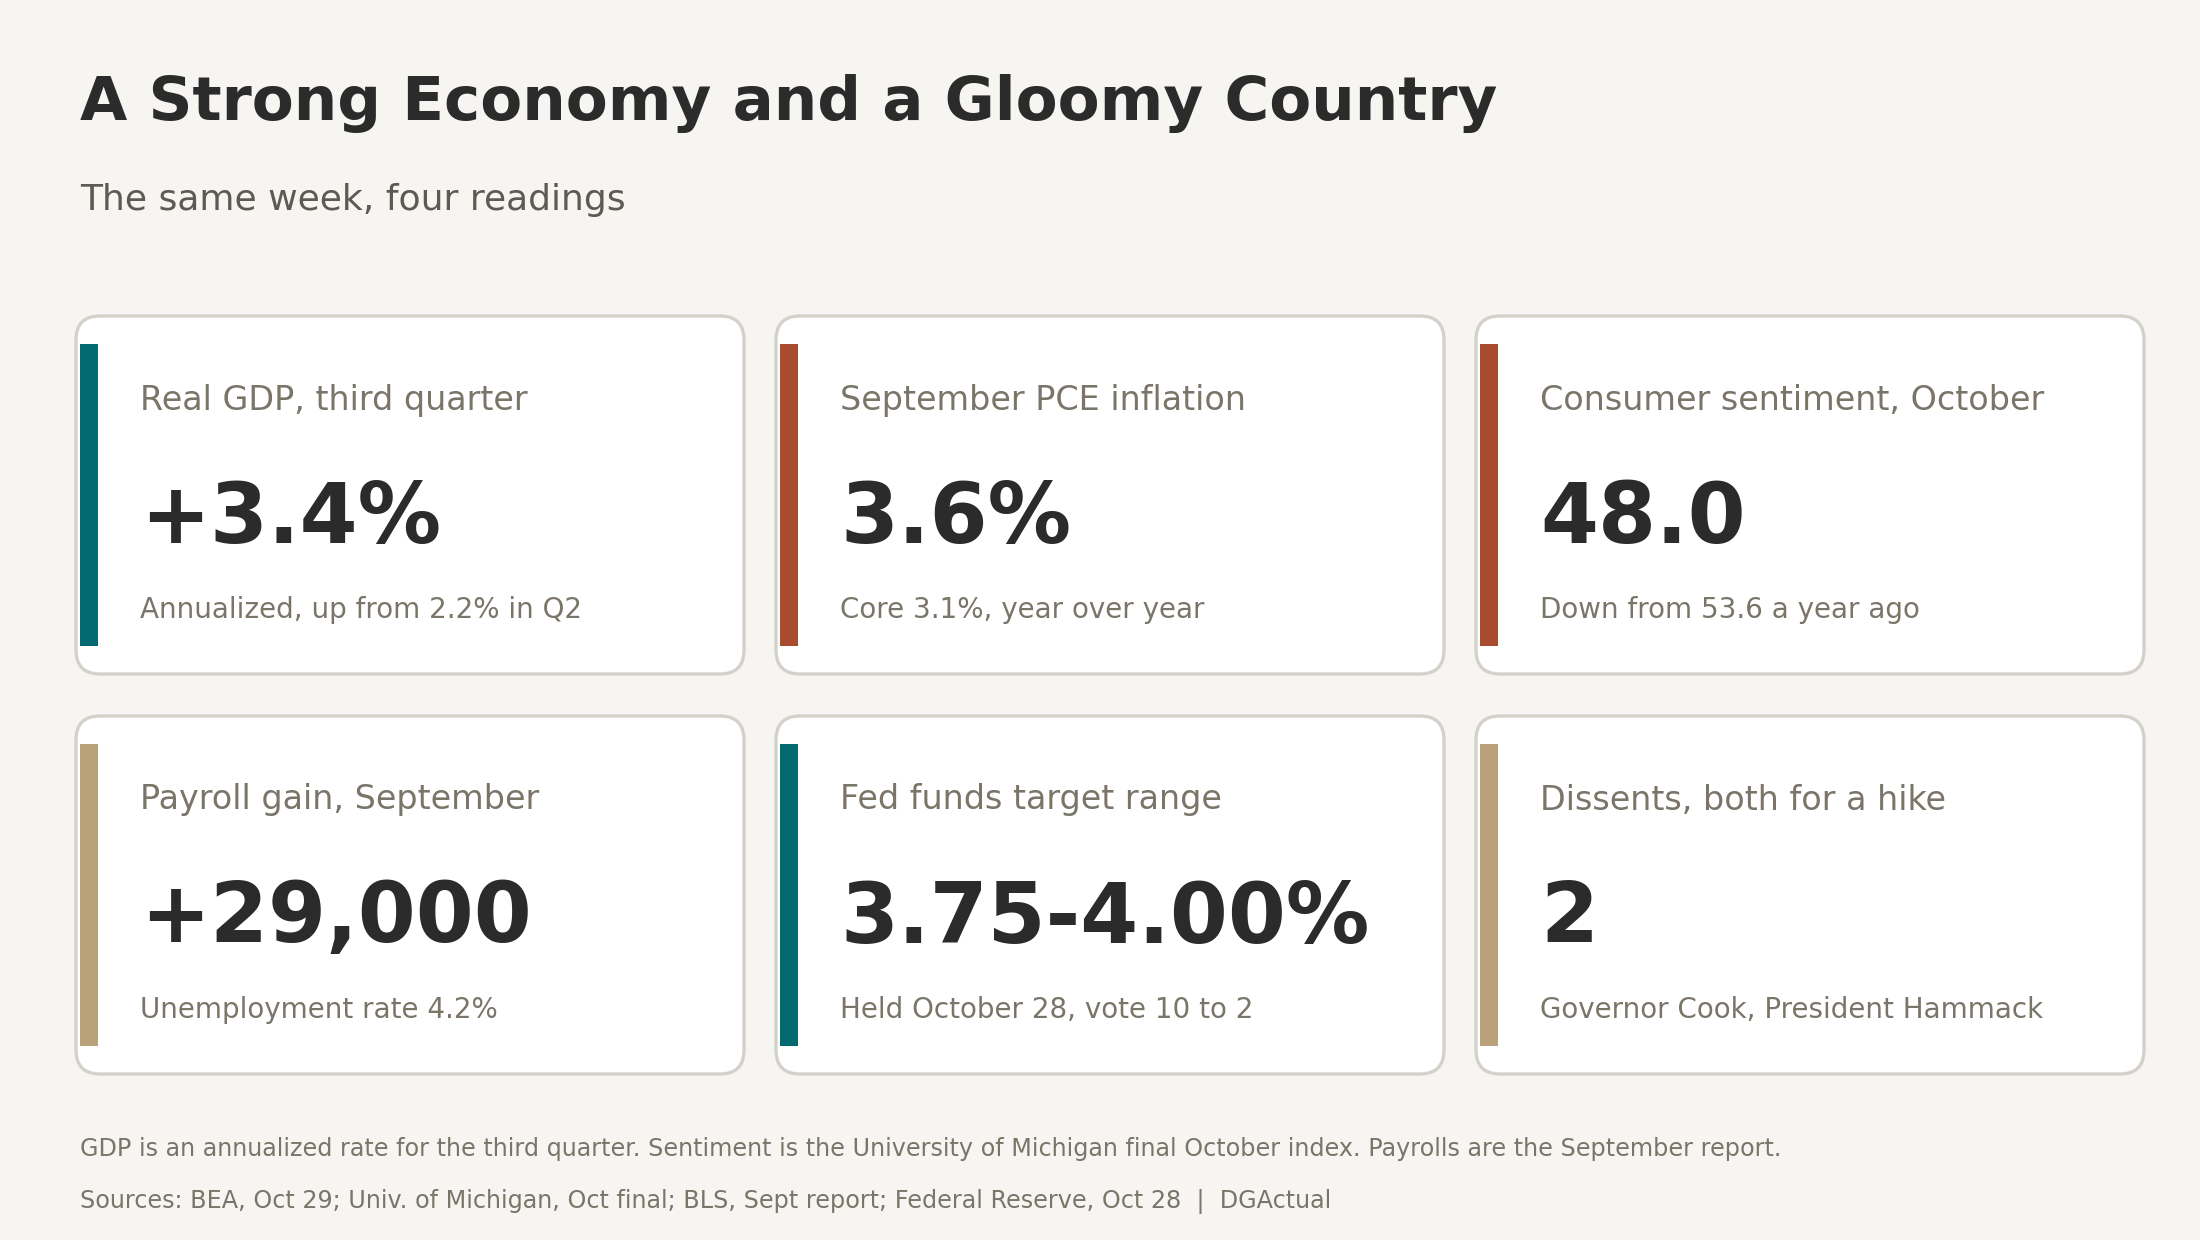
Yet households do not feel it. The University of Michigan's final October reading of consumer sentiment was 48.0, against 53.6 a year earlier, and September's payroll report showed a gain of only 29,000 jobs with unemployment at 4.2%. A strong GDP number and a gloomy shopper can both be true, because one measures what the economy produced and the other measures how people feel. The next section is about where that gap shows up for a dealer.
Price vs Payment
Here is where a Fed decision stops being abstract. The October forecast from J.D. Power and GlobalData has new-vehicle sales running at a SAAR of 15.6 million, flat with last year. SAAR is the seasonally adjusted annual rate, meaning the pace of one month's sales stretched across a full year so months can be compared fairly. The retail piece, the part dealers actually feel, is forecast at 13.0 million, down 0.2 million.
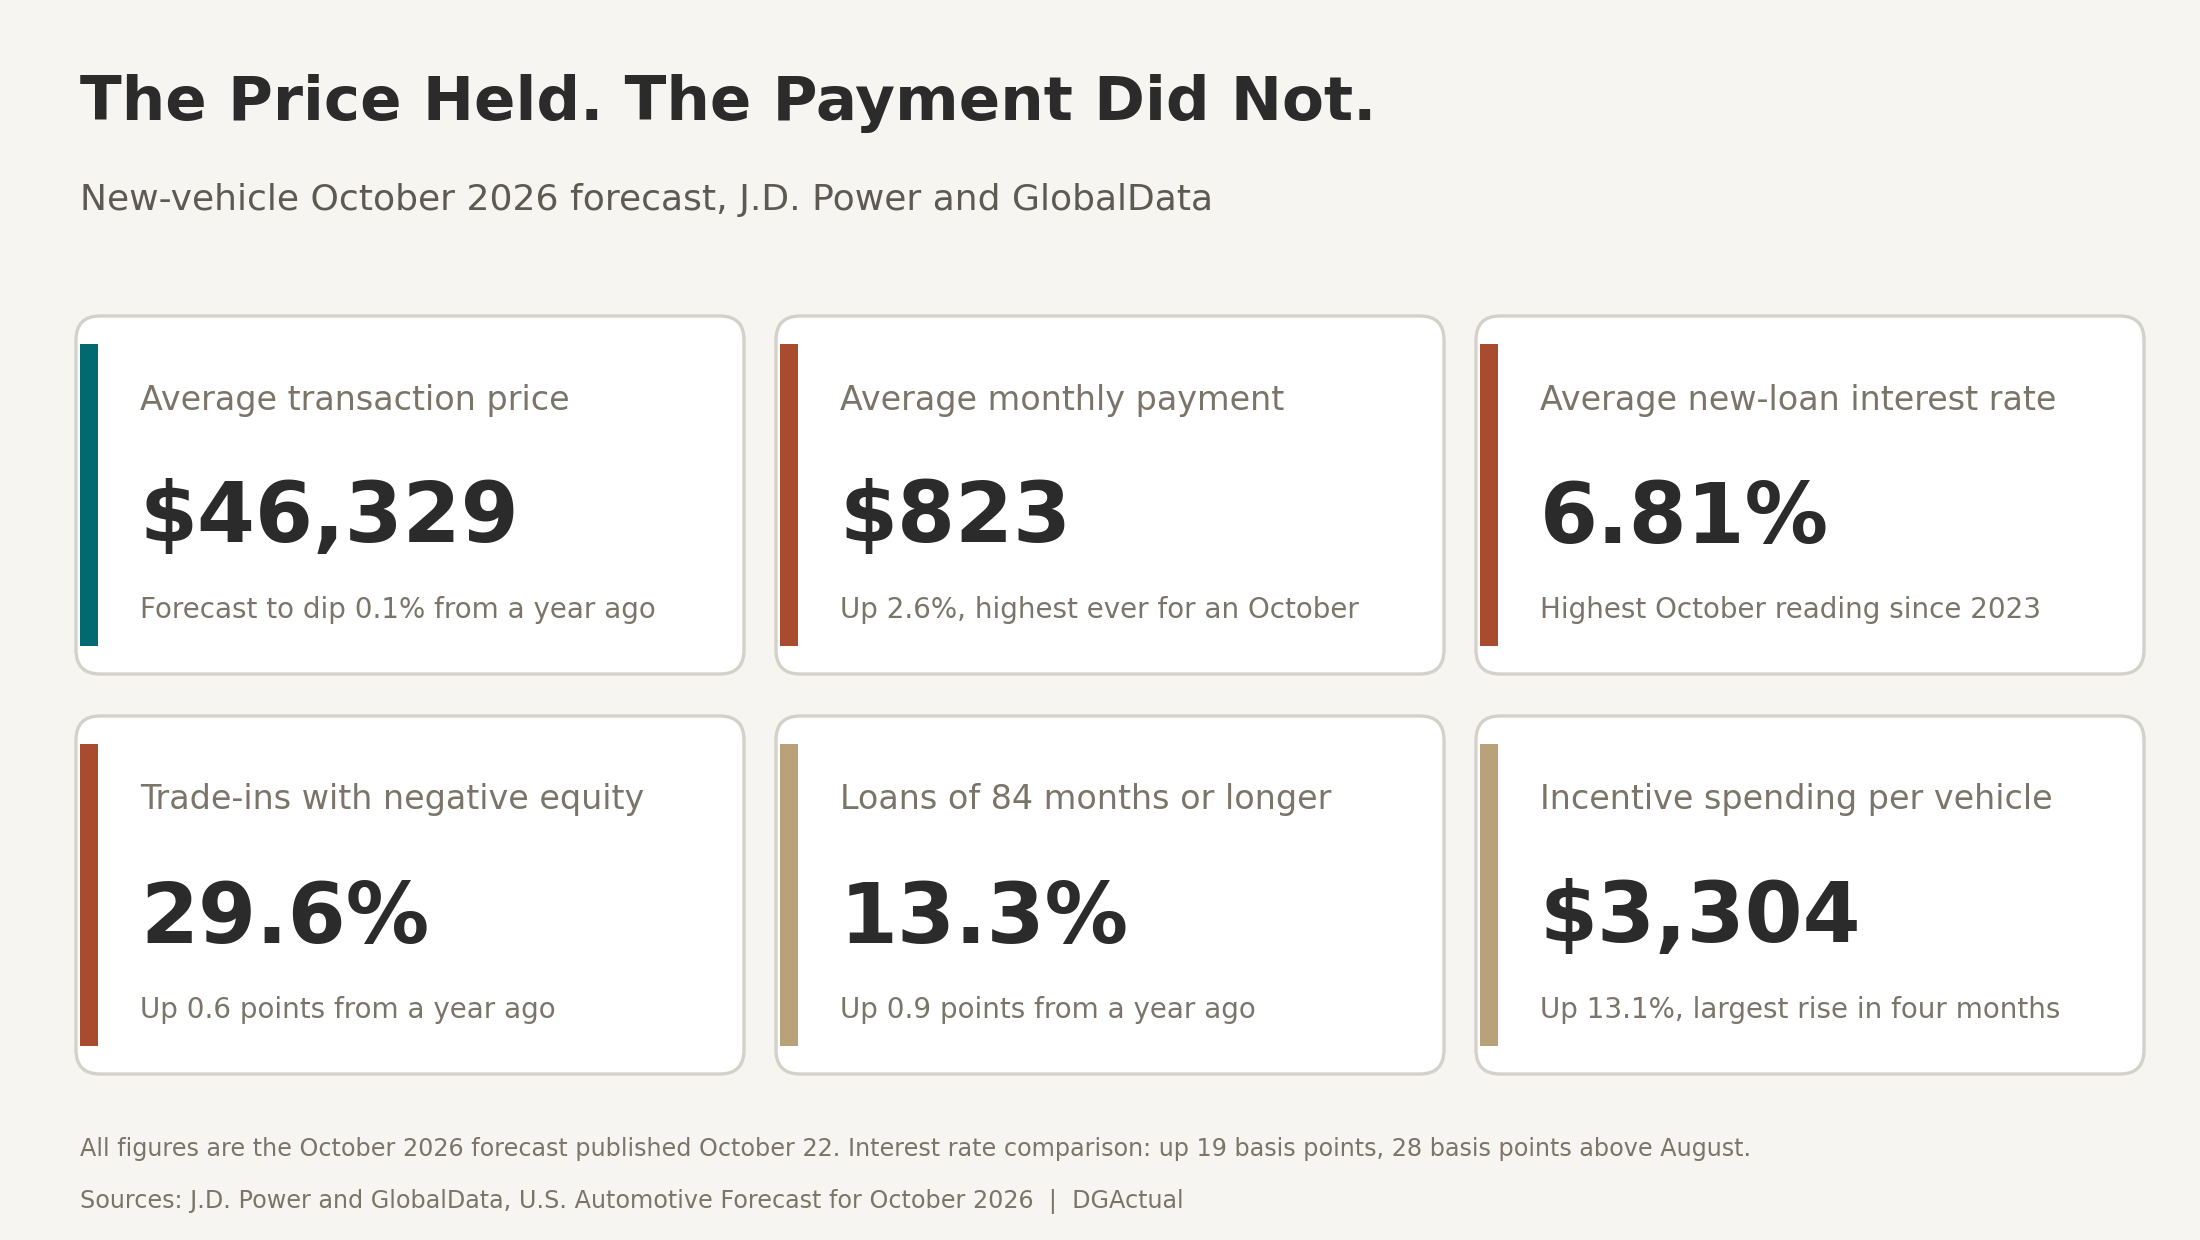
The card shows a price that barely moved next to a payment that did. The forecasters blame higher interest rates and lower trade-in equity, because both raise the amount financed and the cost of financing it. The 6.81% loan rate is the highest for an October since 2023, and 28 basis points above August. A basis point is one hundredth of a percentage point.
Shoppers are stretching to cope, with more 84-month loans, and manufacturers are leaning on incentives to keep them in the market. Both are on the card.
The Used Lot
Cheaper cars are moving faster off dealer lots, though the sales numbers do not simply say shoppers are trading down. Edmunds figures reported by CNBC show the days a dealer took to sell a car fell the most in the cheapest tier, 20% between the first and third quarters, and by less in each tier above it. Everything above $50,000 took more than 60 days.
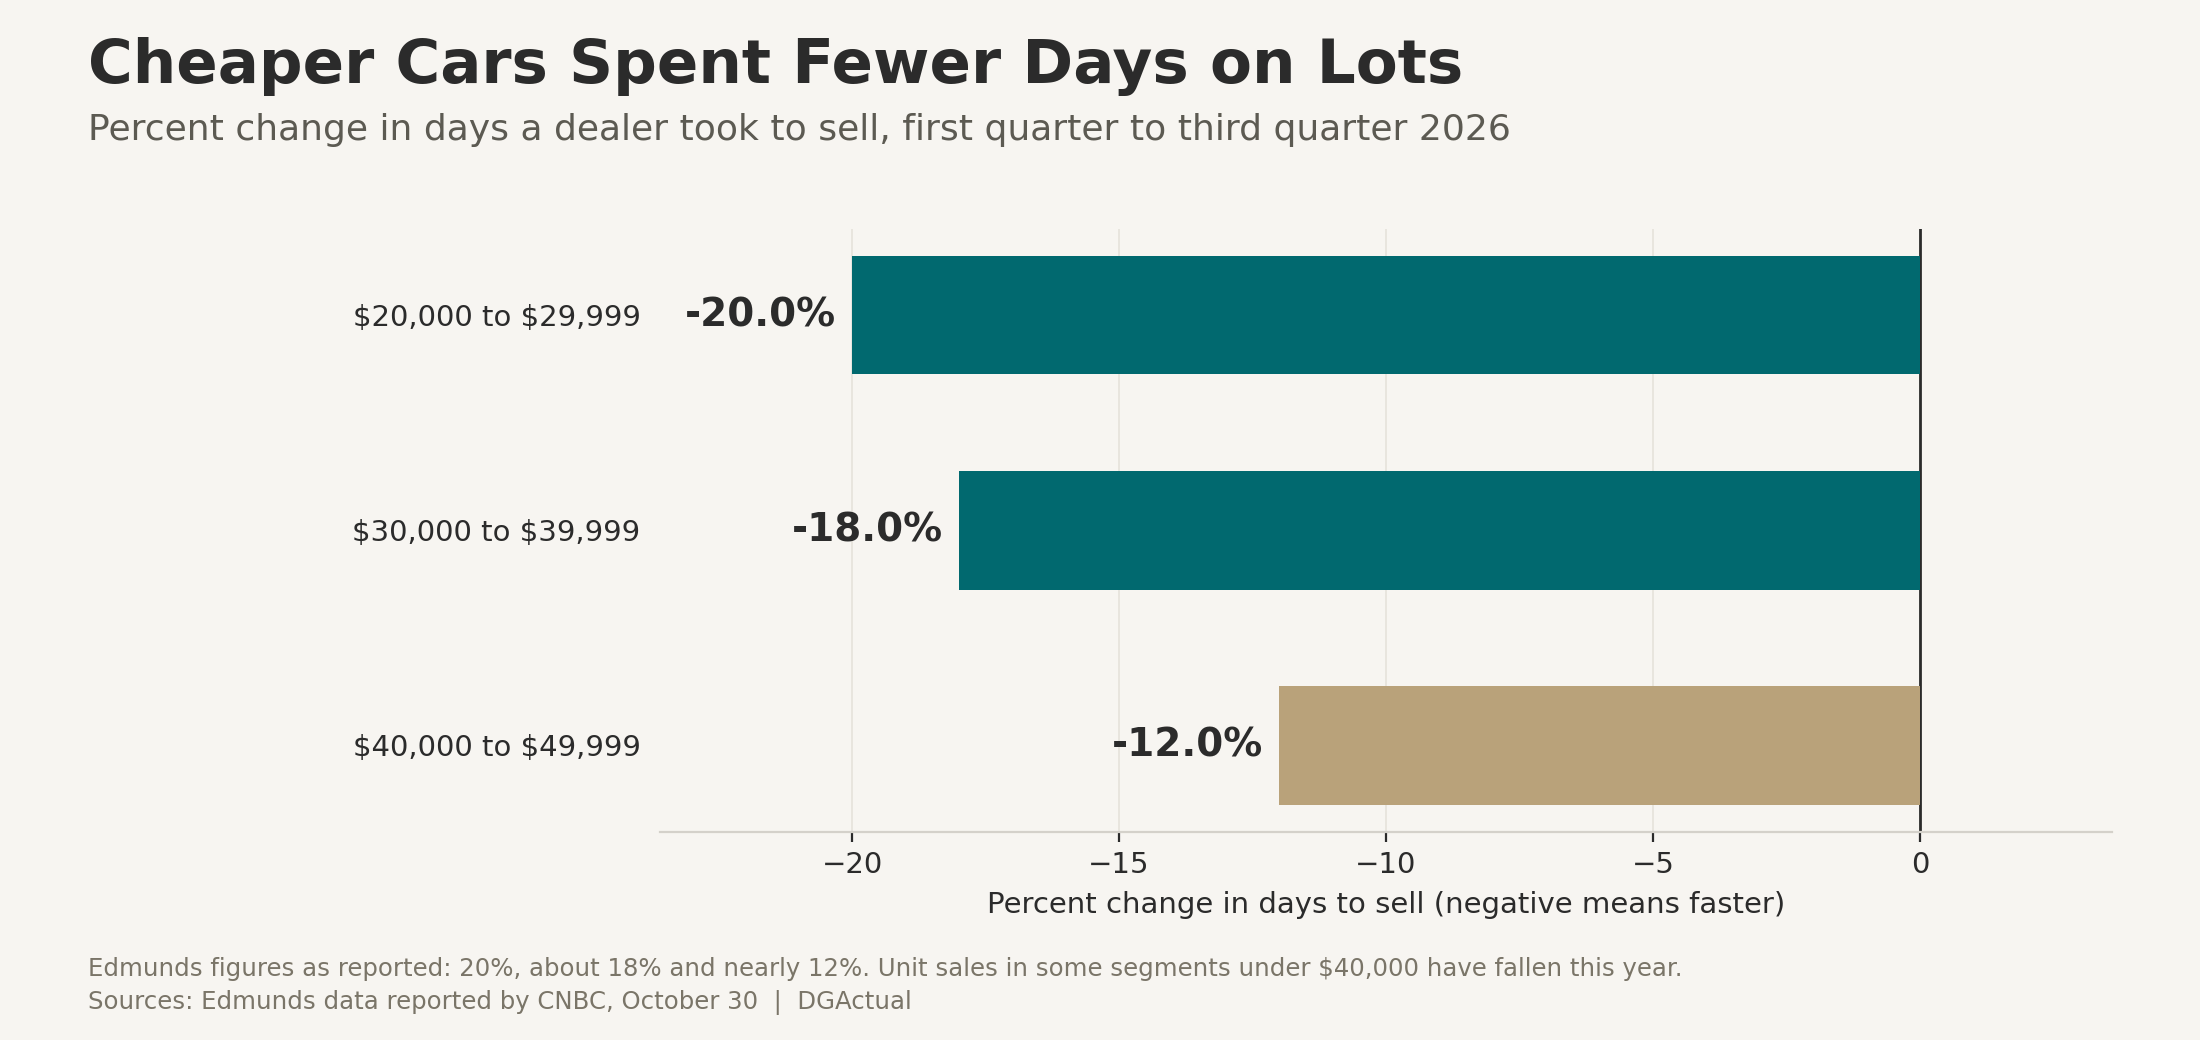
The same CNBC report adds a catch. Unit sales in some segments priced under $40,000 have fallen, so faster days-to-sell sits beside lower volume. An industry economist suggested supply at that end of the market is part of it. AutoForecast Solutions' Sam Fiorani offered a demand-side explanation: compact-car buyers are price sensitive, so higher gas prices eat into the car payment. A buyer who cannot afford $500 or $600 a month moves into the used market. Neither reading is settled, and fourth-quarter data should help. Gas is easing, with AAA's national average at $4.17 on November 1 against $4.29 a week earlier, but AAA notes crude above $100 a barrel is limiting how far it falls.
The auction lanes are softening too. Black Book's week ending October 24 showed wholesale values down 0.61% for cars and 0.75% for trucks and SUVs. Retail listings were rising and retail prices declining. Days to turn, the time a car sits before selling, was near 38 and heading toward 40. That is the setting for our own index.
DARPI
DARPI tracks used retail asking prices from dealer listings across 11 vehicle segments, indexed to 100 at June 8. Near-New fell to 93.42, its sixteenth straight decline, and Value fell to 94.10. The last reading was October 18, so the 0.72 point slide in Near-New covers two weeks, not one. From its June 22 peak of 100.05, the index is down 6.63 points.
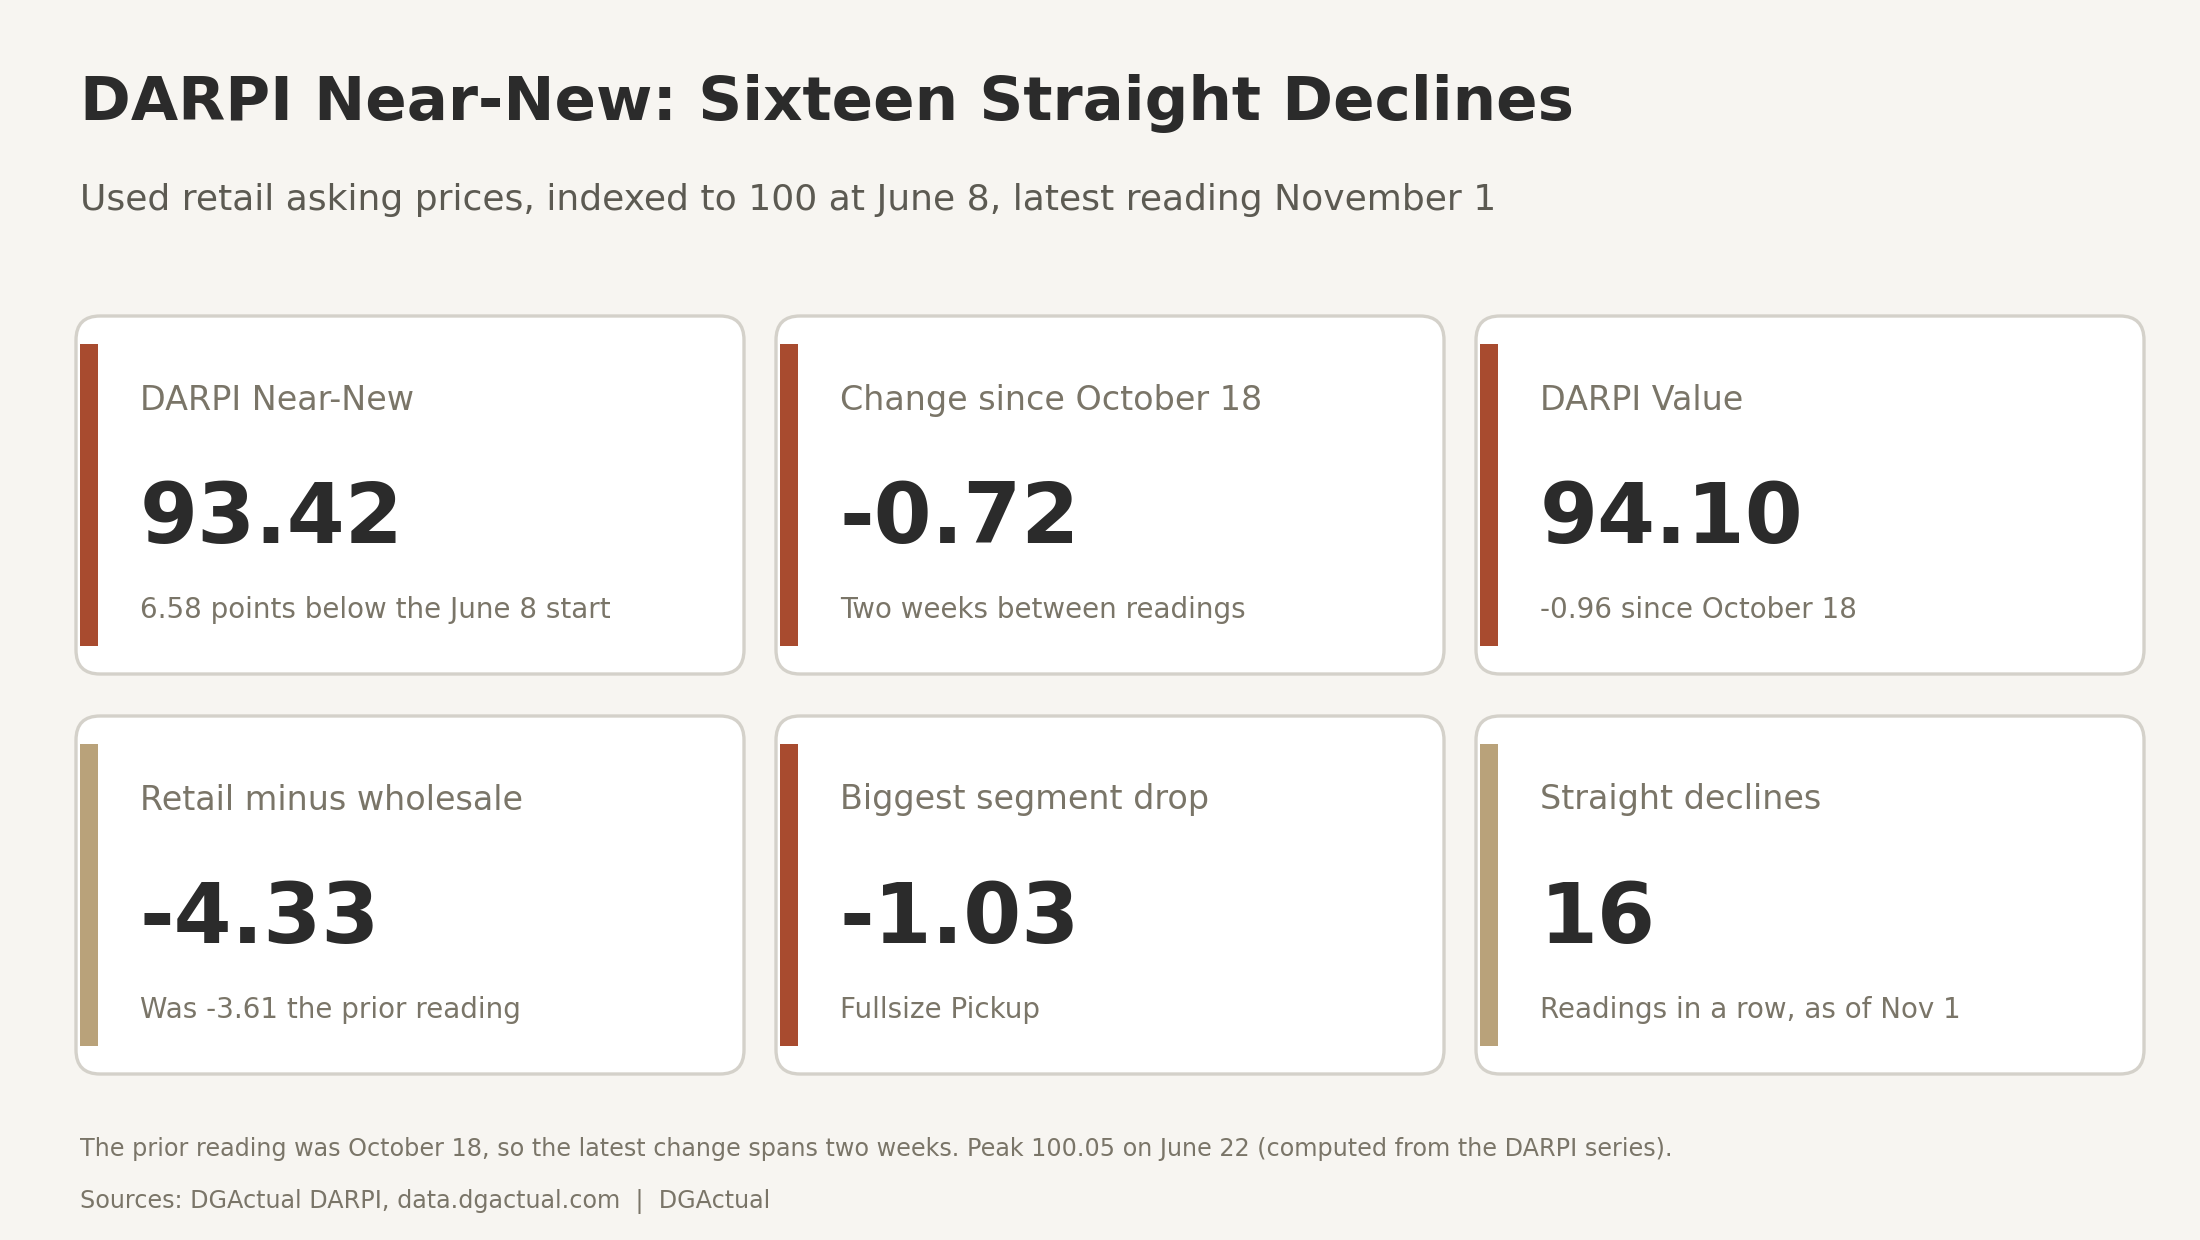
The spread between our retail read and the Manheim wholesale index widened to negative 4.33 points from negative 3.61. A more negative number means asking prices sit further below the wholesale benchmark. Fullsize Pickups led the drop at 1.03 points, followed by Luxury SUVs at 0.94 and Minivans at 0.88. Our market signal reads that both volume and prices are contracting.
Each of the ten segments we publish fell in this reading, so the pressure is broad and not limited to one corner of the lot. One honest limit: DARPI is asking prices from one listings provider and does not capture negotiation or incentives, so treat a segment move as an exposure marker rather than a loss on any single car. We can see where prices are falling, and we cannot say from this data why.
FSBO Desk
FSBO means for sale by owner, a private seller listing directly instead of through a dealership. Every comparison runs both sides through the same mileage band, and the cohort is model years 2022 to 2025, so a high-mile private car does not fake a discount. A model counts as an opportunity when the matched gap is more than $500 with at least 10 matched private listings.
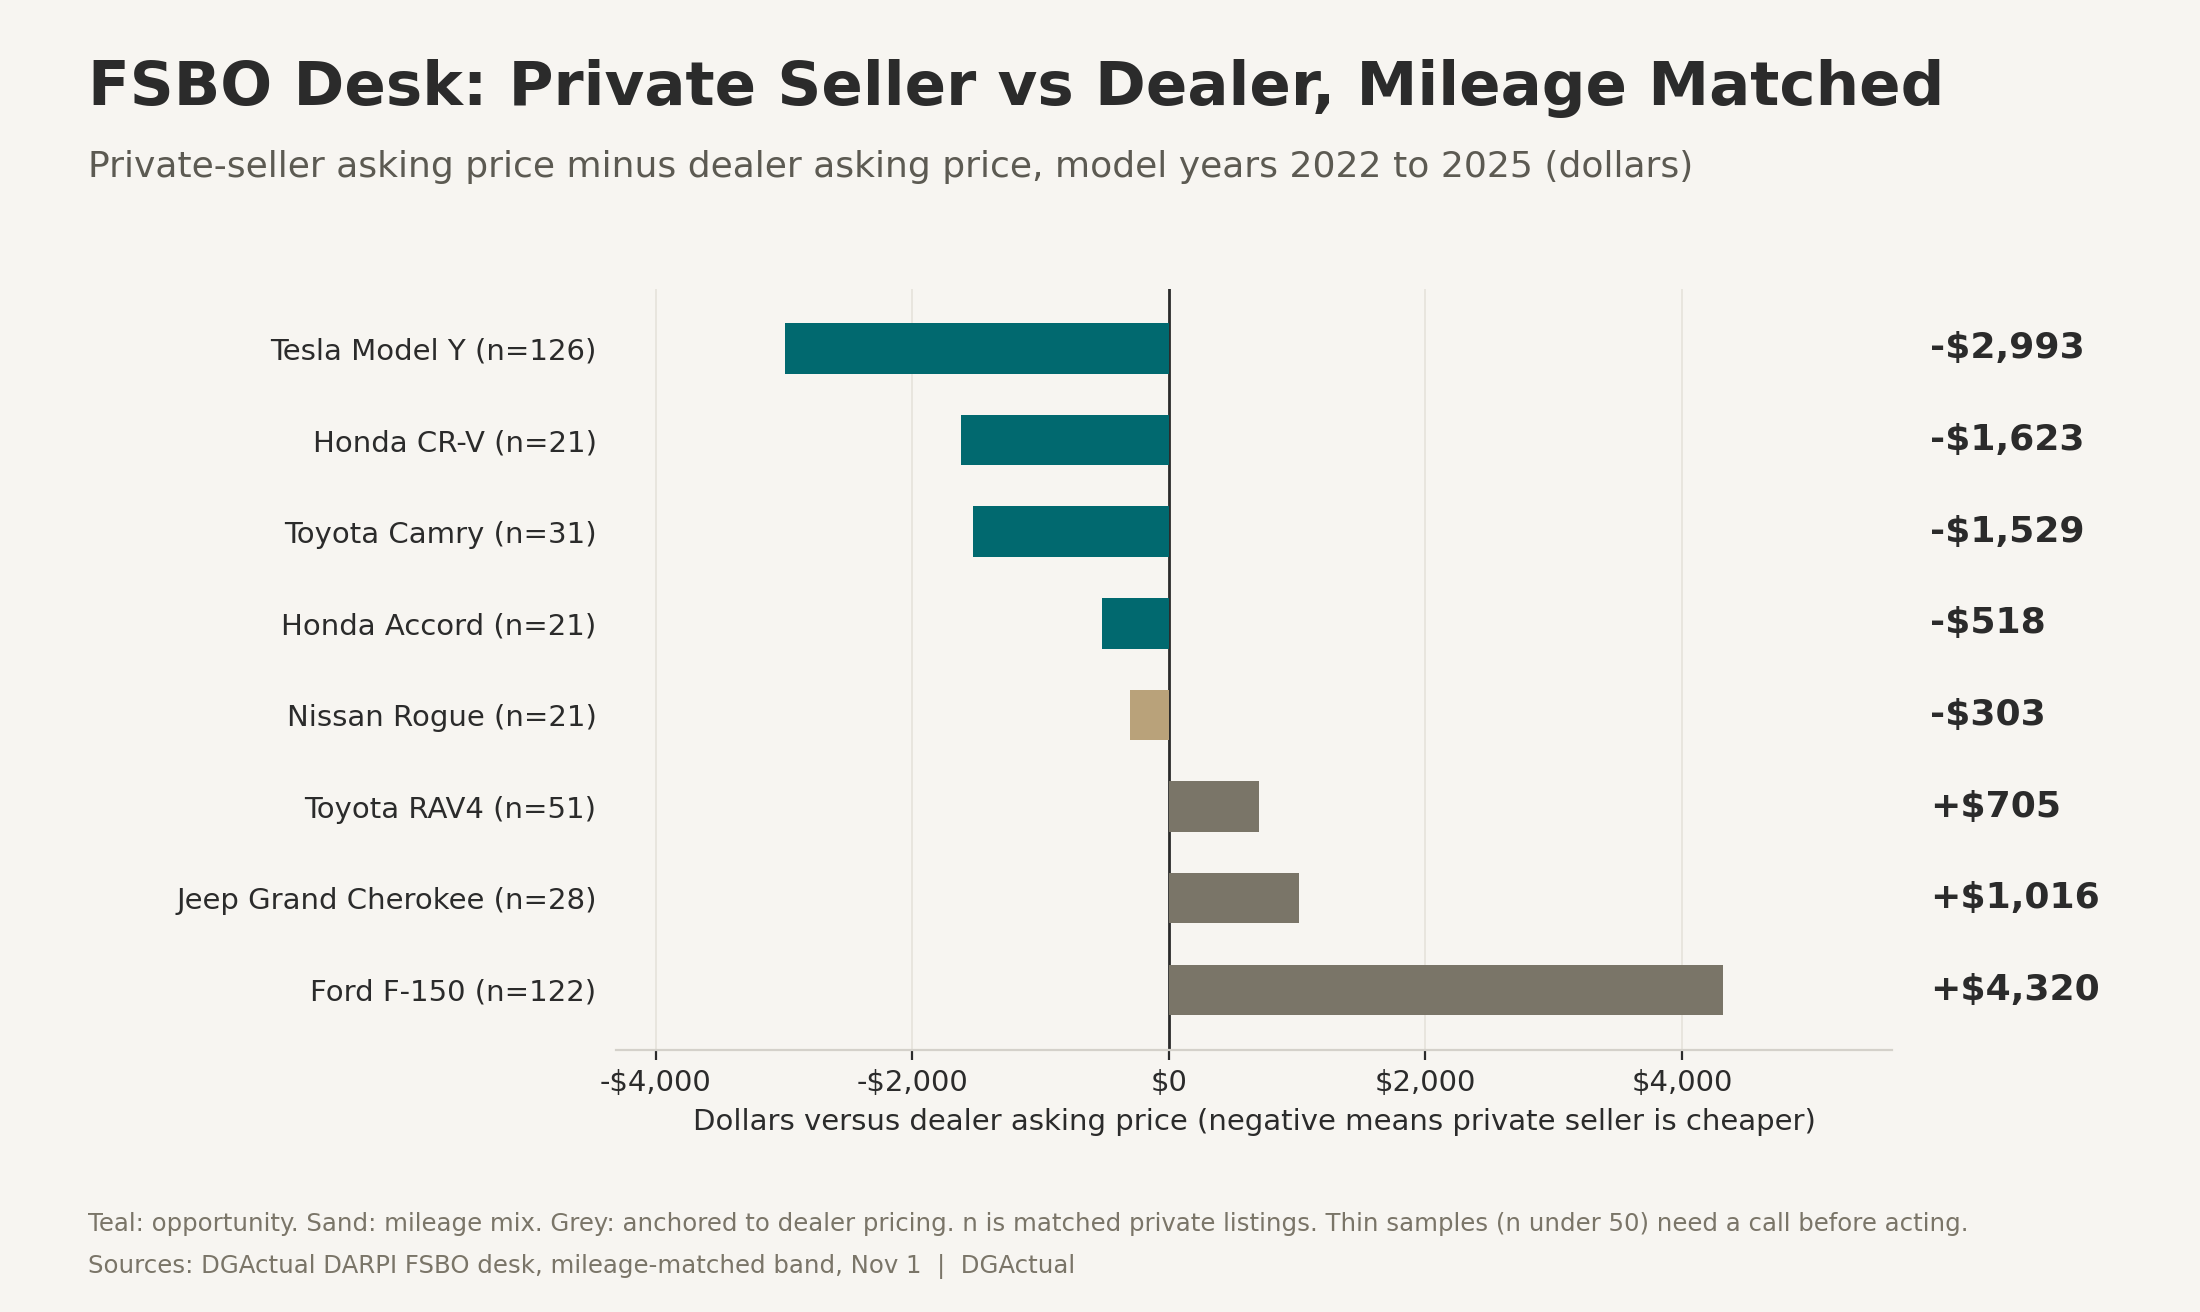
Four models clear the bar. The Tesla Model Y is the best supported, with 126 matched private listings behind a $2,993 gap. It also has a clock gap: across all 219 private listings the average has been up 166 days, against 24 days for the average dealer listing. The CR-V, Camry and Accord are real but thin, with 21, 31 and 21 matched listings, so confirm the car in front of you before you build a bid on the average.
The Nissan Rogue is the cautionary one. It looks $605 cheaper on the raw numbers and only $303 once mileage is matched, which is a mileage mix and not a discount. The RAV4, Grand Cherokee and F-150 sit above dealer pricing, so private sellers are not undercutting there.
Inside the Public Groups
How long has service been growing? At AutoNation, Penske and Sonic, parts and service gross profit has beaten the year before in each of the last 9 quarters we can verify, back to the third quarter of 2024. That is the streak. The chart shows the other half: the growth rate has faded from double digits to low single digits, and Group 1 and Asbury have now dipped below zero.
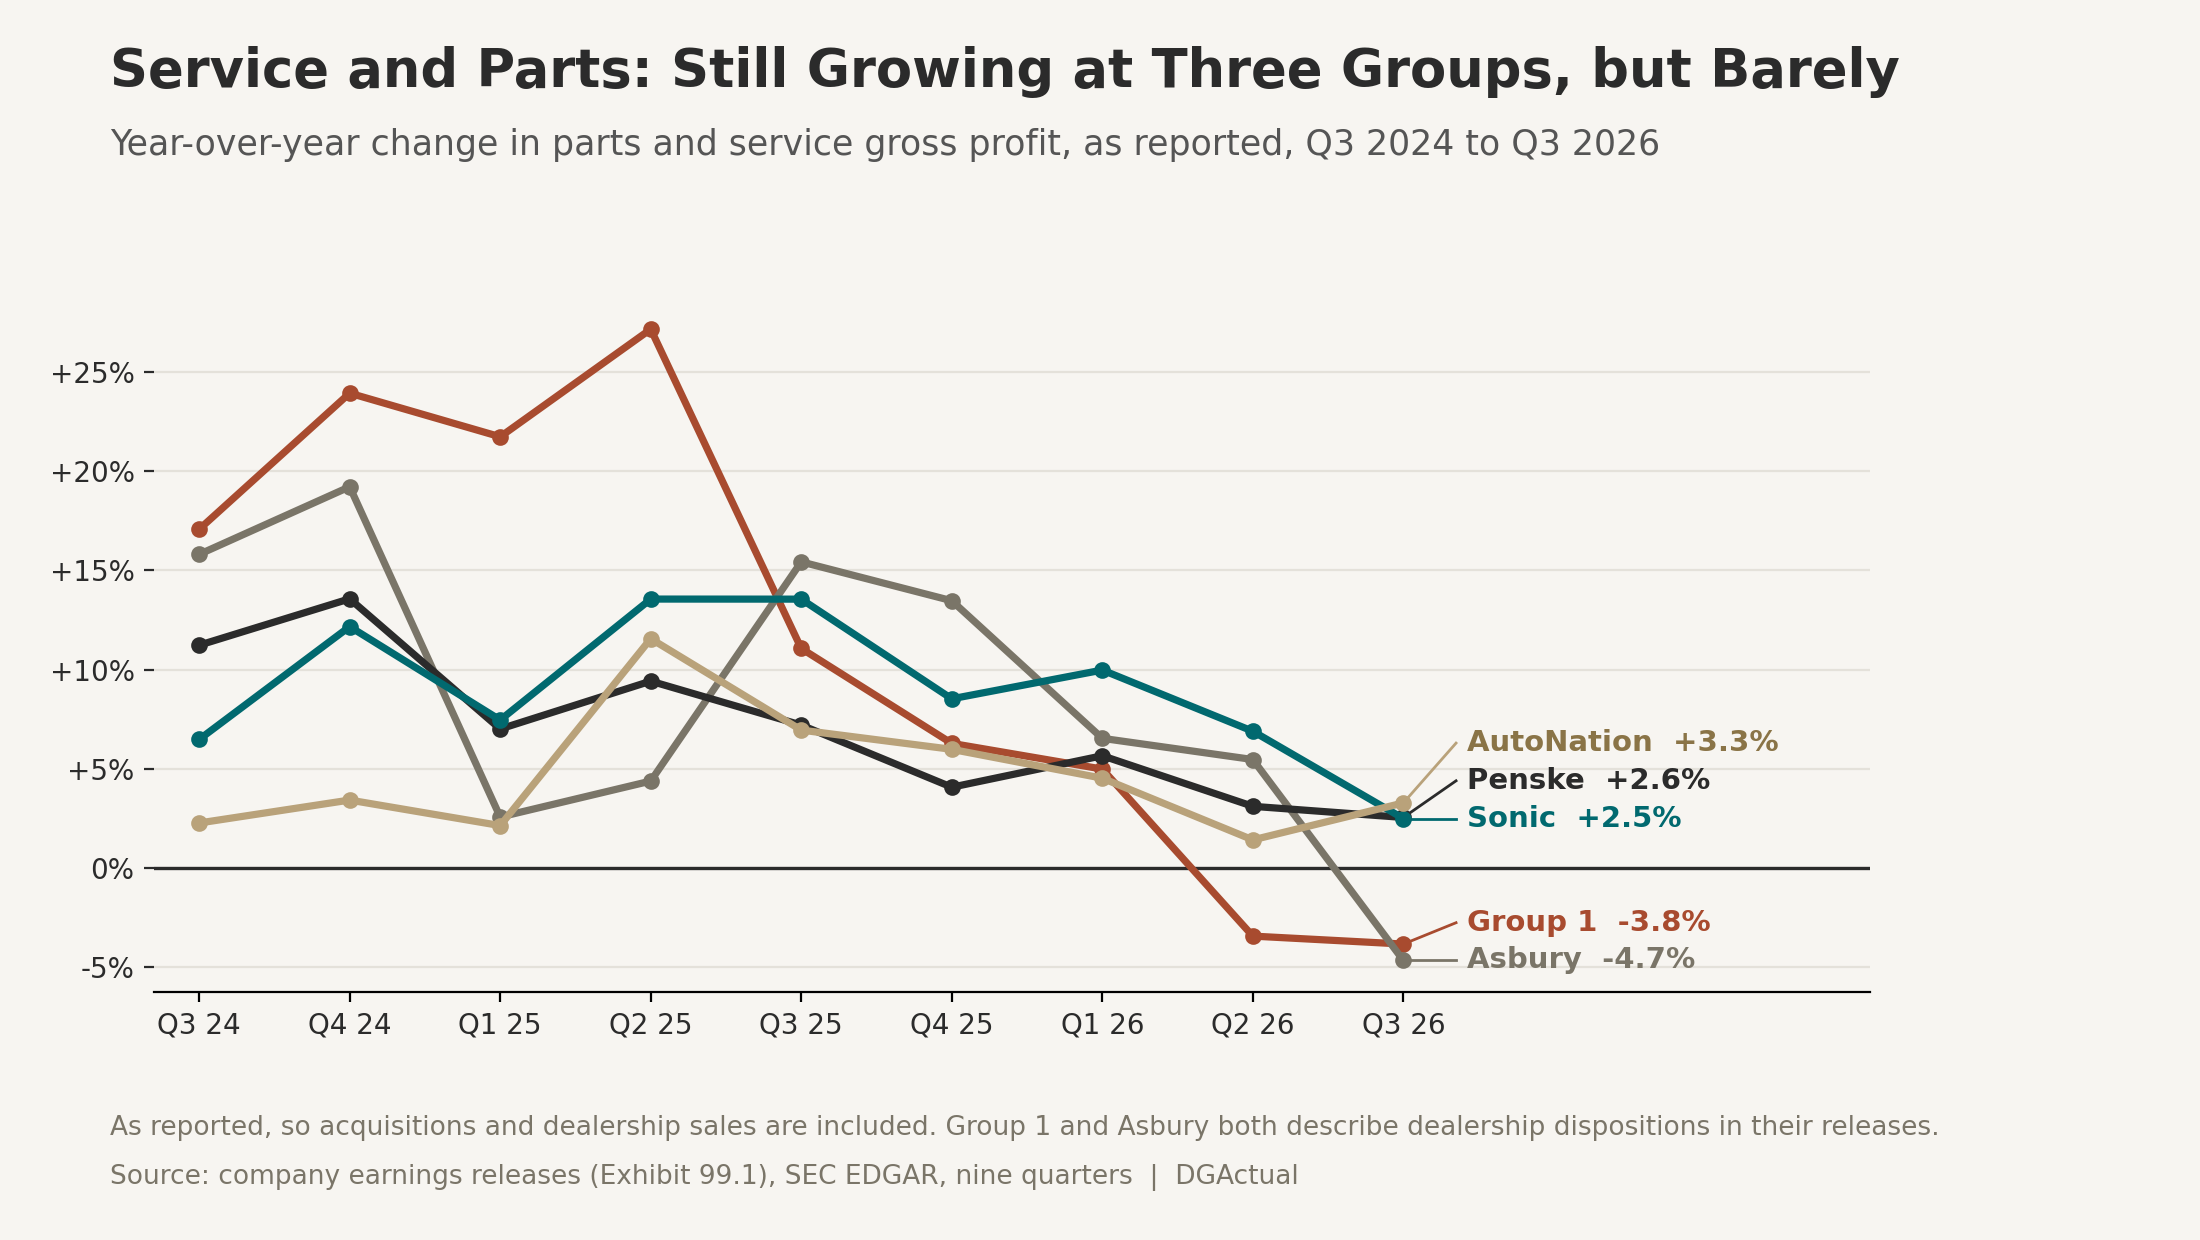
Sonic gives the cleanest read because it reports same-store fixed operations, which strips out store purchases and sales. Its growth peaked at 12% and is now 1%, with customer pay flat. Growing, yes. Accelerating, no. Group 1 and Asbury both describe dealership sales in their releases, so their as-reported figures are not a clean read on the market.
Even so, service is carrying the quarter. Across the five groups it was the only department to grow, up $5.5 million, while new vehicle gross profit fell $73.2 million and finance and insurance fell $74.7 million. Service is now 48.1% of their gross profit, up from 46.2%. Those five-group totals combine as-reported results, so read them as a description of these five reports and not a market measure.
Management is explaining it in affordability terms. Group 1 said its average service-drive vehicle has over 67,000 miles, ran a $17.76 oil change campaign that drew over 36,000 customers, and saw 12,200 customers apply for financing on large repair bills, up 7% from a year earlier. Sonic said its customers are not trading down to independent shops. Our reading, not theirs: with the monthly payment on a new car at a record, more owners may be repairing the car they have. The filings show service holding up while payments climb. They do not show that one causes the other.
Finance and insurance lost nearly as many dollars as new vehicles. At AutoNation, Group 1 and Asbury the cause was mostly fewer cars sold and not smaller profit per car. Asbury's per-car F&I was $2,176 against $2,182, which is nearly flat, while its F&I gross profit fell 8.9%. Their retail unit sales fell 4% to 9%, while J.D. Power's October forecast has the retail pace down about 1.5%. A gap that wide suggests company-specific factors such as store sales, though the filings do not say how much. Asbury also expects its in-house F&I product company to stay a drag into next year.
Carvana traded margin for volume. Its profit per car from finance and related products fell 10.1% as units rose 39.4%, and management said it passed gains back to customers through lower loan rates. Sonic's EchoPark used-car arm shows the same shape, with F&I per car down 15% on 22% more cars, but management blamed a mix of electric and higher-mileage vehicles that are harder to sell products on, not a pricing choice.
AutoNation's captive lender is the opposite case. AutoNation Finance reported income of $15.4 million against $1.5 million a year ago, on a loan book that grew 29.6% since December to $2.86 billion. Its two highest credit tiers rose to 65.5% of the book from 53.2%, and the past-due share eased to 2.48% from 2.68%. That is a prime-leaning lender with improving numbers. It is not a read on subprime stress, which Fitch put at 6.13% in July.
Regulation reached the finance office too. A settlement that reaches dealers takes effect today. Forty-one state attorneys general announced a $694 million settlement with subprime lender Credit Acceptance in September, effective November 2, according to Connecticut's attorney general. It resolves allegations that the lender encouraged and failed to reasonably prevent dealers from packing service contracts and GAP products onto loans, meaning adding them when buyers did not know or were told they were required. Separately, the FTC's October 8 order against Greenway Auto Group requires the actual total price to be the most prominent figure in its advertising. The agency alleged buyers paid more than $3,350 above the advertised price in over 92% of transactions.
Credit quality is a split picture. Fitch reported subprime auto loan delinquencies of 6.13% in July, with prime at 0.49%, and expects performance to weaken in the second half. Equifax shows total auto accounts 60 or more days past due at 1.7% in August, down 10.9% from a year earlier. The two measure different things, Fitch the weakest loans packaged into bonds in July and Equifax all auto accounts in August, so read them as two views and not one trend.
Scoreboard
The monthly Dealer Reputation Scoreboard at reviews.dgactual.com, which tracks Google ratings for franchise dealerships, refreshed this weekend. We compare each dealer to the prior month and keep only the 14,834 stores that match cleanly between the two snapshots, so a changed Google listing does not pose as a rating swing. Some store records are still being refreshed through mid-November, so these results describe that matched set.
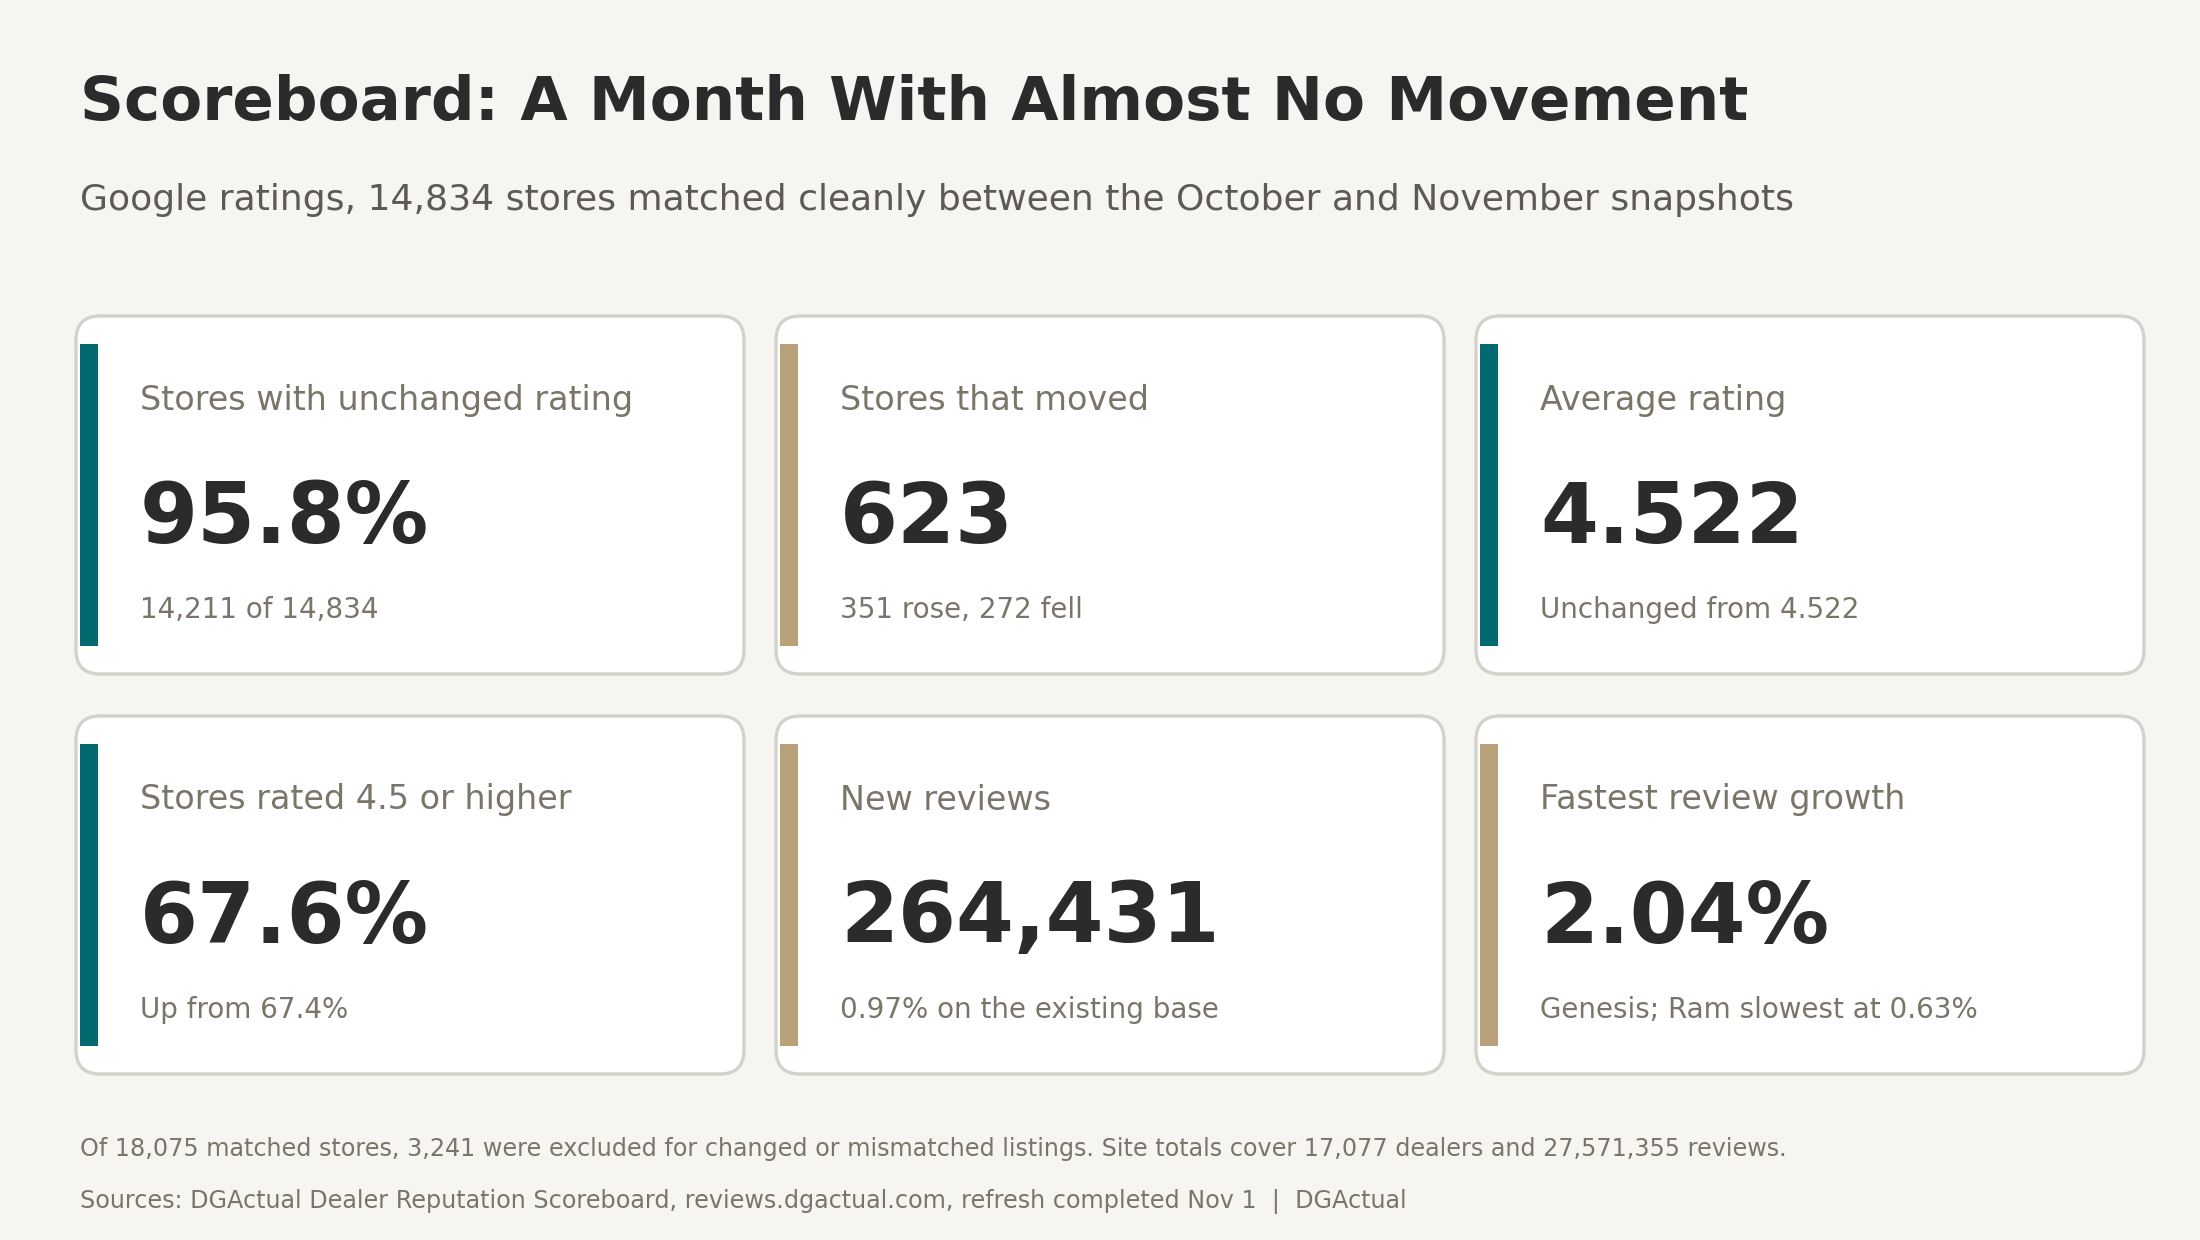
The headline is how little moved. Nearly every store kept its rating, and the average held flat while the share rated 4.5 or higher edged up. Reviews kept arriving at a steady clip. At the brand level Porsche leads the full site at 4.68 and FIAT trails at 4.33, across 17,077 dealers.
Week Ahead
Tuesday, November 3 is Election Day. Friday, November 6 brings the October jobs report at 8:30 a.m. Eastern, and the University of Michigan releases its preliminary November sentiment reading the same morning at 10 a.m. The next Fed decision is in December.
Looking ahead, our model projects SAAR for the fourth quarter of 2026 at 16.22 million, below the 16.65 million third-quarter level it started from. Our measure runs above the light-vehicle SAAR the sales trackers publish because it includes medium and heavy trucks, so the 15.6 million October forecast is the better comparison for a store.